Syngene International – Daily & Weekly Chart Analysis
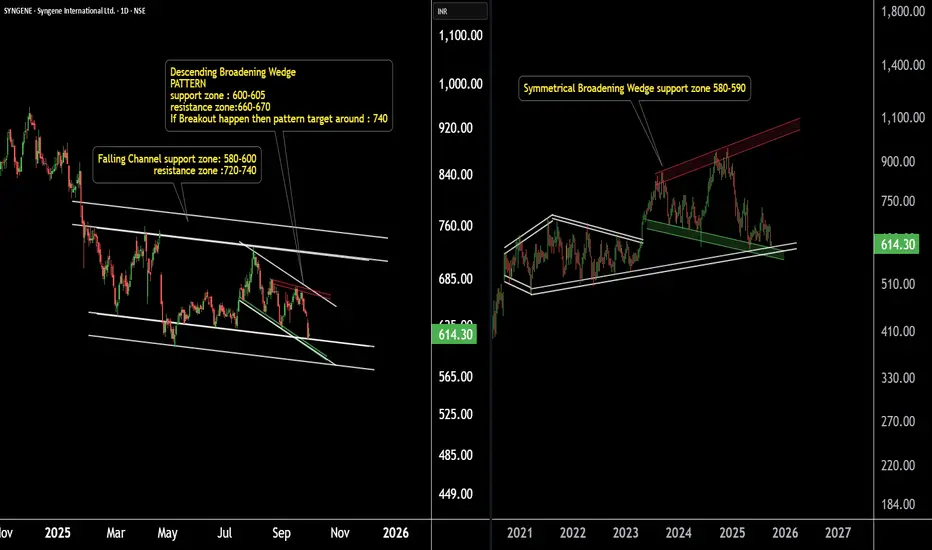
Syngene International is exhibiting a confluence of patterns across multiple timeframes, all aligning near a strong support zone.
On the weekly chart, the stock is forming a broadening wedge pattern, with a key support zone around ₹580–590.
On the daily chart, Syngene is trading within a well-defined falling channel, with support again placed near ₹580–590.
Additionally, the price structure is also shaping into a descending broadening wedge, with support around ₹590–600.
Key Insight:
The presence of multiple patterns converging near the same support zone highlights the significance of this level. Sustaining above ₹580–600 could pave the way for a strong reversal move in the coming sessions.
@RahulSaraoge
Connect us at t.me/stridesadvisory
Connect us at t.me/stridesadvisory
Clause de non-responsabilité
Les informations et publications ne sont pas destinées à être, et ne constituent pas, des conseils ou recommandations financiers, d'investissement, de trading ou autres fournis ou approuvés par TradingView. Pour en savoir plus, consultez les Conditions d'utilisation.