TCS – Retest Breakout Trading Setup with Price Action + Fibonacci Strategy
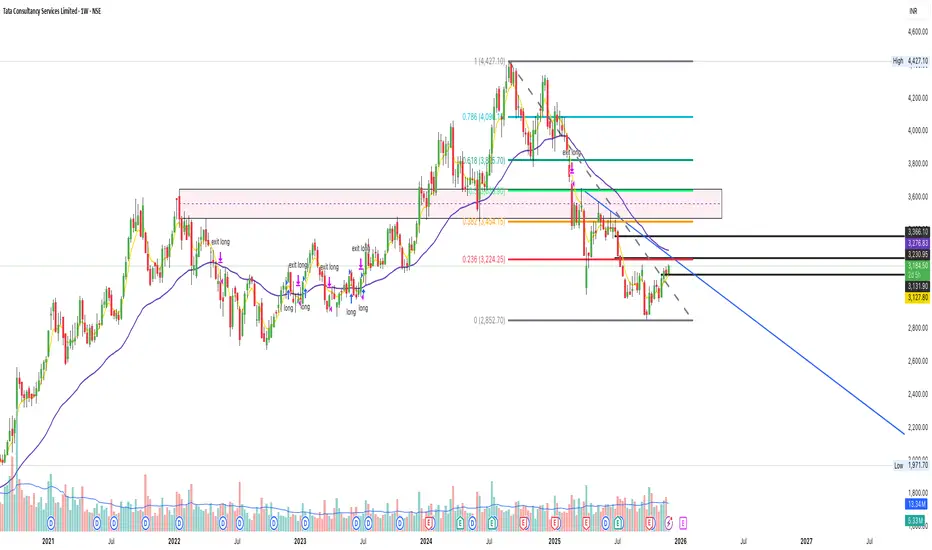
TCS is approaching a key breakout zone around ₹3,280. A retest entry can offer a high-probability trade setup.
How to Trade This Setup
1️⃣ Breakout Level
₹3,280 is the major resistance zone
Wait for strong breakout candle closing above ₹3,280
2️⃣ Retest Entry
📍 After breakout, price may pull back to ₹3,280–₹3,260
📍 Look for bullish rejection candle (Pin bar / Hammer / Engulfing)
👉 Entry on bullish close after retest
3️⃣ Stop-Loss (Price Action Based)
🛑 SL below ₹3,085 (strong support level)
4️⃣ Targets using Fibonacci
🎯 T1: ₹3,350
🎯 T2: ₹3,400
🎯 T3: ₹3,456 (Fib 38.2%)
Strategy Summary
Element Value
Breakout zone ₹3,280
Retest entry ₹3,280–₹3,260
SL ₹3,085
Targets ₹3,350 / ₹3,400 / ₹3,456
Direction Bullish above breakout
View
Bullish bias if price sustains above ₹3,280.
Retest entry gives the safest low-risk setup. 🚀
Clause de non-responsabilité
Les informations et publications ne sont pas destinées à être, et ne constituent pas, des conseils ou recommandations financiers, d'investissement, de trading ou autres fournis ou approuvés par TradingView. Pour en savoir plus, consultez les Conditions d'utilisation.
Clause de non-responsabilité
Les informations et publications ne sont pas destinées à être, et ne constituent pas, des conseils ou recommandations financiers, d'investissement, de trading ou autres fournis ou approuvés par TradingView. Pour en savoir plus, consultez les Conditions d'utilisation.