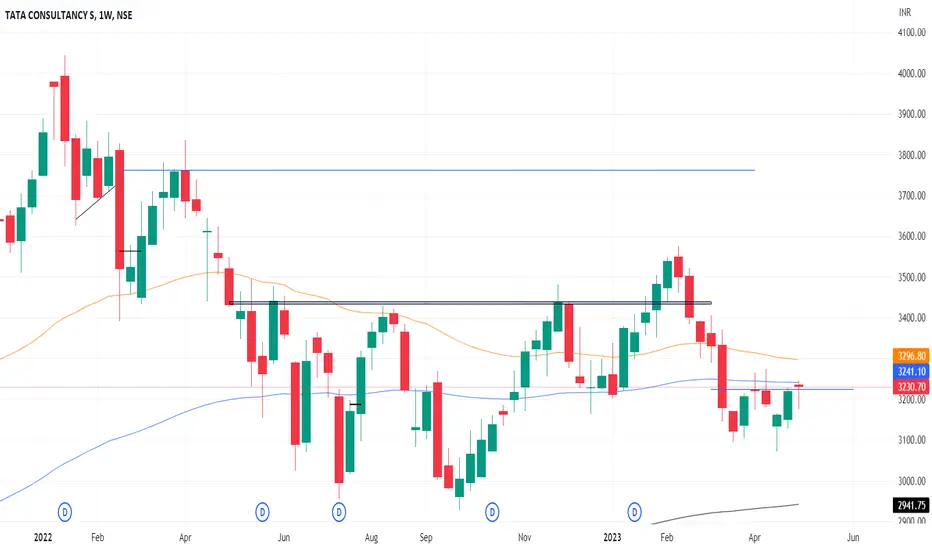
In the Weekly Chart of TCS ,
we can see that, it has a recovery in W pattern.
Bullish Candle is foamed on support.
Enter on breaking its high with Low as SL and Go very Long.
we can see that, it has a recovery in W pattern.
Bullish Candle is foamed on support.
Enter on breaking its high with Low as SL and Go very Long.
Clause de non-responsabilité
Les informations et publications ne sont pas destinées à être, et ne constituent pas, des conseils ou recommandations financiers, d'investissement, de trading ou autres fournis ou approuvés par TradingView. Pour en savoir plus, consultez les Conditions d'utilisation.
Clause de non-responsabilité
Les informations et publications ne sont pas destinées à être, et ne constituent pas, des conseils ou recommandations financiers, d'investissement, de trading ou autres fournis ou approuvés par TradingView. Pour en savoir plus, consultez les Conditions d'utilisation.