📌 Recent Price & Context
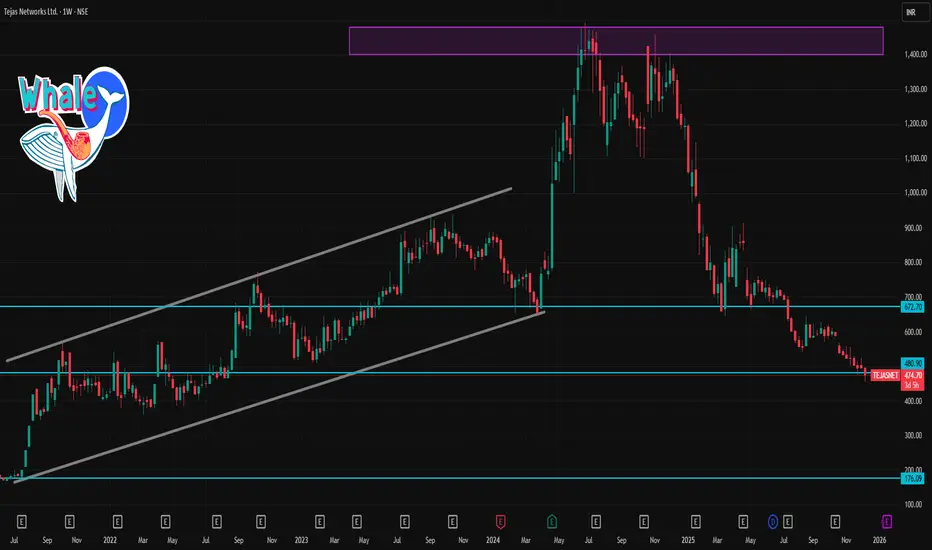
According to a live quote on 9 Dec 2025, Tejas Networks is trading around ₹471–₹476.
Recent technical‑indicator feeds (on daily chart) show oversold conditions: e.g. RSI ~ 20 (oversold), MACD negative, ADX high — indicating downward momentum + volatility.
On weekly‑timeframe classification, some aggregator sources rate the trend as “strong sell.”
So at this moment, the bias is bearish to neutral, unless a reversal catalyst emerges.
🎯 Weekly Pivot / Key Levels (Support & Resistance)
Using the most recent weekly pivot analysis:
Level Price (Approx)
Weekly Pivot (central) ₹503.7
Support Zone 1 (S1) ~ ₹482.5
Support Zone 2 (S2) ~ ₹470.9
Resistance 1 (R1) ~ ₹515.3
Resistance 2 (R2) ~ ₹536.5
Resistance 3 (R3) ~ ₹548.0–₹550+
Interpretation
The pivot at ₹503.7 marks the “line of neutrality.” Weekly closes above this level would shift bias more bullish.
As of now, with price ~ ₹472–₹476, the stock is well below weekly pivot → bearish / consolidation regime.
Downside buffer / support lies around ₹470–₹482; a breakdown below that could open further downside risk (unless long‑term support zones hold).
Upside resistance cluster lies at ₹515 → ₹536 → ₹548. To regain bullish momentum, price needs to first clear ₹503–₹515 zone, then aim higher.
Publications connexes
Clause de non-responsabilité
Les informations et publications ne sont pas destinées à être, et ne constituent pas, des conseils ou recommandations financiers, d'investissement, de trading ou autres fournis ou approuvés par TradingView. Pour en savoir plus, consultez les Conditions d'utilisation.