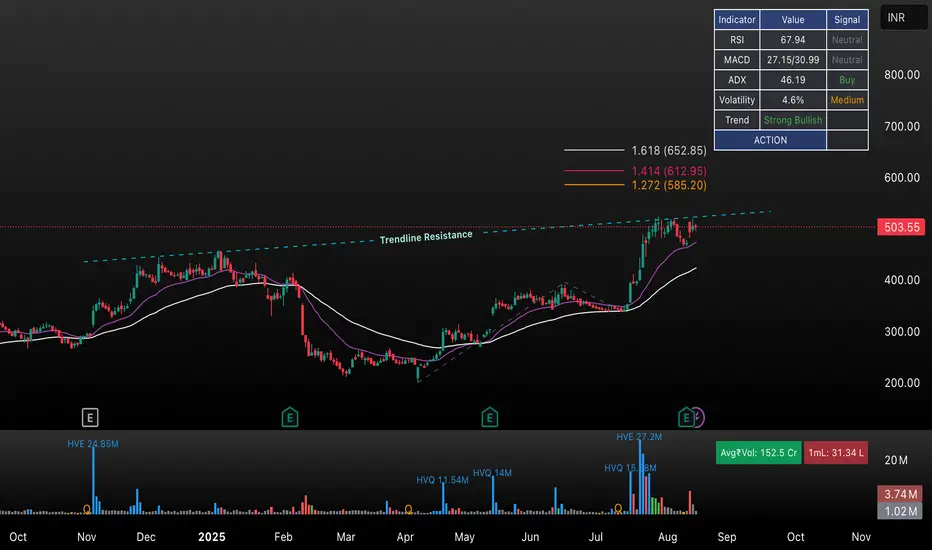
This TradingView chart analyzes the price action of TI stock using key technical indicators and trend projections as of August 2025. The chart displays:
• Current Price: ₹503.55
• Technical Indicators:
• RSI: 67.94 (Neutral)
• MACD: 27.15/30.99 (Neutral)
• ADX: 46.19 (Bullish/Buy)
• Volatility: 4.6% (Medium)
• Trend: Strong Bullish
• Chart Features:
• Trendline Resistance: Marked above the current price, serving as immediate resistance.
• Fibonacci Extension Levels: Key levels indicated at 1.272 (₹585.20), 1.414 (₹612.95), 1.618 (₹652.85), highlighting possible future price targets after breakout.
• Moving Averages: Two major moving averages (likely 20 EMA and 50 EMA) supporting the uptrend.
• Volume Bars: Indication of recent high volume activities and possible accumulation.
• Market Sentiment: The overall trend remains strongly bullish, but the price is currently testing its trendline resistance. Short-term action depends on whether this resistance is broken or holds.
Summary:
This chart setup provides a comprehensive view for swing traders and investors, focusing on possible breakout levels, critical resistance zones, and momentum confirmation using multiple indicators. The bullish bias is validated by strong trend momentum and the positioning above moving averages, but careful watch is needed near resistance for possible pullbacks or breakout opportunities.
Clause de non-responsabilité
Les informations et publications ne sont pas destinées à être, et ne constituent pas, des conseils ou recommandations financiers, d'investissement, de trading ou autres fournis ou approuvés par TradingView. Pour en savoir plus, consultez les Conditions d'utilisation.
Clause de non-responsabilité
Les informations et publications ne sont pas destinées à être, et ne constituent pas, des conseils ou recommandations financiers, d'investissement, de trading ou autres fournis ou approuvés par TradingView. Pour en savoir plus, consultez les Conditions d'utilisation.