Description
The stock selection setup is a multi-layered technical approach to identify strong individual stocks likely to outperform the broader market. It combines trend-following, relative strength (RS), and momentum analysis using Know Sure Thing (KST) indicator.
Key Components
Price and Simple Moving Average (SMA):
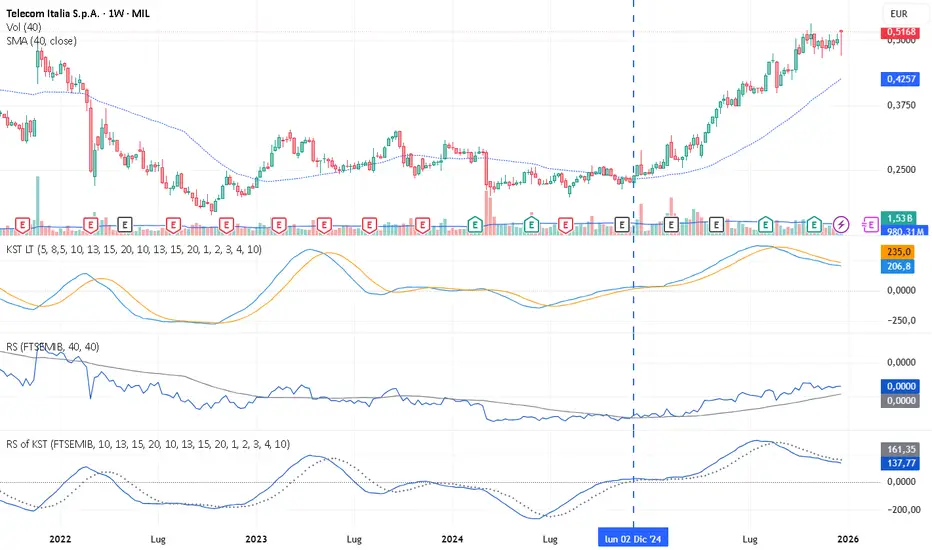
The foundation is the stock's price action relative to a long-term SMA (a 40-weeks or a 200-day period). The stock should be in a clear uptrend, trading above its SMA. This confirms the primary bullish trend and filters out weak or declining stocks.
Relative Strength (RS) of the Stock vs. a Reference Index:
RS is calculated as the stock's price divided by a benchmark index (e.g., FTSE MIB, DAX, S&P 500, etc.). A rising RS line indicates the stock is outperforming the market and confirmation of the RS line above the long-term SMA emphasizes that the stocks is in an uptrend or making new highs, showing leadership compared to the reference index.
KST of the Price:
The KST (Know Sure Thing) is a momentum oscillator, a weighted sum of smoothed rates-of-change (ROC) over multiple timeframes: Typically: (10-weeks SMA of 10-weeks ROC × 1) + (13-weeks SMA of 13-weeks ROC × 2) + (15-weeks SMA of 15-weeks ROC × 3) + (20-weeks SMA of 20-weeks ROC × 4).
A signal line (e.g., 10-weeks SMA of KST) is often added.
Applied directly to the stock's price, a KST above the zero line confirms building momentum; a bullish crossover above its signal line can signalize potential entry points.
RS of the long-term KST:
This is a key refinement: Compare the KST of the raw price to the KST of the referenc index (subtraction method) allows to identify if the stock's outperformance is accelerating (momentum in relative strength), which is a stronger signal of leadership than RS alone.
Hence, the RS of the long-term KST above the zero line confirms leadership momentum.
How the Setup Works for Stock Selection
The method aims to pick stocks with both absolute strength (good price trend and momentum) and relative strength (beating the market with accelerating outperformance). The ideal "buy" setup requires alignment across these layers:
- Price > SMA (bullish trend).
- RS > SMA (in an uptrend - outperforming the index).
- KST (price) bullish (positive and rising).
- RS of KST bullish (showing momentum in outperformance — this filters for true leaders).
This multi-confirmation reduces false signals and focuses on stocks in strong, sustained uptrends. Apply this in the context of market cycles, industry rotation, and broader trends, but the core stock-picking filter is this combination.
The stock selection setup is a multi-layered technical approach to identify strong individual stocks likely to outperform the broader market. It combines trend-following, relative strength (RS), and momentum analysis using Know Sure Thing (KST) indicator.
Key Components
Price and Simple Moving Average (SMA):
The foundation is the stock's price action relative to a long-term SMA (a 40-weeks or a 200-day period). The stock should be in a clear uptrend, trading above its SMA. This confirms the primary bullish trend and filters out weak or declining stocks.
Relative Strength (RS) of the Stock vs. a Reference Index:
RS is calculated as the stock's price divided by a benchmark index (e.g., FTSE MIB, DAX, S&P 500, etc.). A rising RS line indicates the stock is outperforming the market and confirmation of the RS line above the long-term SMA emphasizes that the stocks is in an uptrend or making new highs, showing leadership compared to the reference index.
KST of the Price:
The KST (Know Sure Thing) is a momentum oscillator, a weighted sum of smoothed rates-of-change (ROC) over multiple timeframes: Typically: (10-weeks SMA of 10-weeks ROC × 1) + (13-weeks SMA of 13-weeks ROC × 2) + (15-weeks SMA of 15-weeks ROC × 3) + (20-weeks SMA of 20-weeks ROC × 4).
A signal line (e.g., 10-weeks SMA of KST) is often added.
Applied directly to the stock's price, a KST above the zero line confirms building momentum; a bullish crossover above its signal line can signalize potential entry points.
RS of the long-term KST:
This is a key refinement: Compare the KST of the raw price to the KST of the referenc index (subtraction method) allows to identify if the stock's outperformance is accelerating (momentum in relative strength), which is a stronger signal of leadership than RS alone.
Hence, the RS of the long-term KST above the zero line confirms leadership momentum.
How the Setup Works for Stock Selection
The method aims to pick stocks with both absolute strength (good price trend and momentum) and relative strength (beating the market with accelerating outperformance). The ideal "buy" setup requires alignment across these layers:
- Price > SMA (bullish trend).
- RS > SMA (in an uptrend - outperforming the index).
- KST (price) bullish (positive and rising).
- RS of KST bullish (showing momentum in outperformance — this filters for true leaders).
This multi-confirmation reduces false signals and focuses on stocks in strong, sustained uptrends. Apply this in the context of market cycles, industry rotation, and broader trends, but the core stock-picking filter is this combination.
Publications connexes
Clause de non-responsabilité
Les informations et publications ne sont pas destinées à être, et ne constituent pas, des conseils ou recommandations financiers, d'investissement, de trading ou autres fournis ou approuvés par TradingView. Pour en savoir plus, consultez les Conditions d'utilisation.