4 x TOTAL Crypto charts showing ALT Season has Momentum
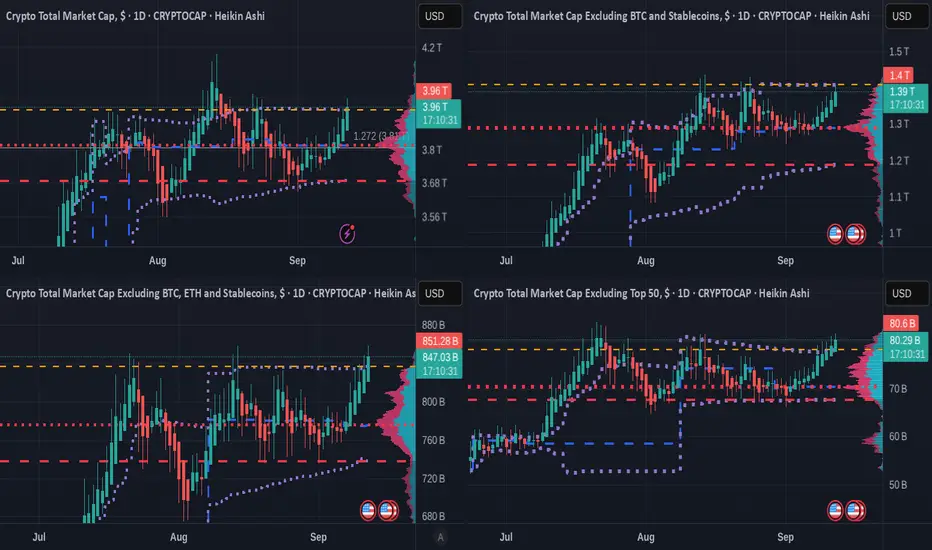
Top line - TOTAL Crypto Market Cap - TOTAL 2 (Excluding BTC )
Bottom Line - TOTAL 3 ( Excluding BTC & ETH ) - OTHERS ( Top 125 coins minus Top 50 by market cap )
TOTAL 3 is ALL ALT coins
OTHERS is Mid to Lower Cap ALT coins
These 4 Charts use the VRVP
he Volume Profile Visible Range (VPVR), is a technical analysis indicator on TradingView that displays the distribution of trading volume at different price levels within the currently visible range of a chart.
The Colour Key is below
Value Area High ( VAH ) - Orange Dashed Line
Value Area Low ( VAL ) - Red Dashed line
Point of Control ( POC ) - Red Dotted line
Developing POC - Blue Dashed line
Developing Value Area - Purple Dotted line
These lines can be seen as lines of support / Resistance.
The 2 Upper charts, we see that PA is being held back on the VAH line.
The 2 Lower charts show us that PA has Broken ABOVE the VAH line.
This shows us more Volume of training is happening on the lower Cap ALTS than the higher cap
It is as simple as that
But we should look at the BTC/Dominance chart


BTC.D is on Support and it has produced bounces in the past
We also see on the 2nd chart how we should have already have had the ALT season...so..It maybe short lived. But the dynamics of the market have changed......
So there we have it, The TOTAL charts for ALTS shows us that ALTS are breaking out but this could be Fragile but by no means does it mean they will crash right away.
But be careful, we are in uncharted territory.
Bottom Line - TOTAL 3 ( Excluding BTC & ETH ) - OTHERS ( Top 125 coins minus Top 50 by market cap )
TOTAL 3 is ALL ALT coins
OTHERS is Mid to Lower Cap ALT coins
These 4 Charts use the VRVP
he Volume Profile Visible Range (VPVR), is a technical analysis indicator on TradingView that displays the distribution of trading volume at different price levels within the currently visible range of a chart.
The Colour Key is below
Value Area High ( VAH ) - Orange Dashed Line
Value Area Low ( VAL ) - Red Dashed line
Point of Control ( POC ) - Red Dotted line
Developing POC - Blue Dashed line
Developing Value Area - Purple Dotted line
These lines can be seen as lines of support / Resistance.
The 2 Upper charts, we see that PA is being held back on the VAH line.
The 2 Lower charts show us that PA has Broken ABOVE the VAH line.
This shows us more Volume of training is happening on the lower Cap ALTS than the higher cap
It is as simple as that
But we should look at the BTC/Dominance chart
BTC.D is on Support and it has produced bounces in the past
We also see on the 2nd chart how we should have already have had the ALT season...so..It maybe short lived. But the dynamics of the market have changed......
So there we have it, The TOTAL charts for ALTS shows us that ALTS are breaking out but this could be Fragile but by no means does it mean they will crash right away.
But be careful, we are in uncharted territory.
Nothing to be taken as Financial advice.
I will always say
"Only invest what you can afford to loose. When you are ready, take out your original investment. This way, it is only your profit that is at risk"
THAT is Financial advice
I will always say
"Only invest what you can afford to loose. When you are ready, take out your original investment. This way, it is only your profit that is at risk"
THAT is Financial advice
Clause de non-responsabilité
Les informations et les publications ne sont pas destinées à être, et ne constituent pas, des conseils ou des recommandations en matière de finance, d'investissement, de trading ou d'autres types de conseils fournis ou approuvés par TradingView. Pour en savoir plus, consultez les Conditions d'utilisation.