Breakdown (what the chart shows):
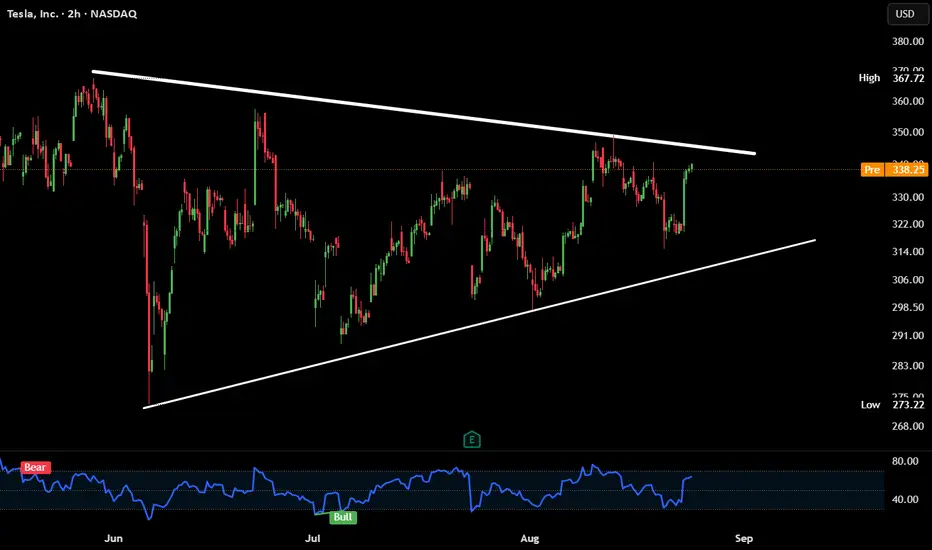
Tesla is forming a symmetrical triangle on the 2H chart. Price is squeezing between higher lows and lower highs.
Currently testing resistance near $338–340. Breakout or rejection incoming.
Confluence:
1. RSI bouncing back from near oversold → bullish momentum returning.
CTA :
Which way do you think it breaks — up or down?
Would you trade the breakout or fade the first move?
Clause de non-responsabilité
Les informations et publications ne sont pas destinées à être, et ne constituent pas, des conseils ou recommandations financiers, d'investissement, de trading ou autres fournis ou approuvés par TradingView. Pour en savoir plus, consultez les Conditions d'utilisation.
Clause de non-responsabilité
Les informations et publications ne sont pas destinées à être, et ne constituent pas, des conseils ou recommandations financiers, d'investissement, de trading ou autres fournis ou approuvés par TradingView. Pour en savoir plus, consultez les Conditions d'utilisation.