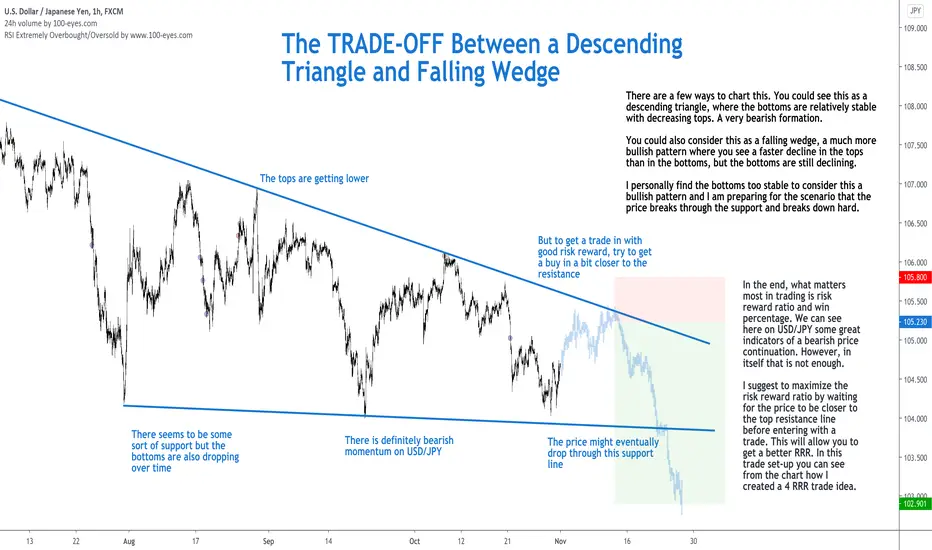
There are a few ways to chart this. You could see this as a descending triangle, where the bottoms are relatively stable with decreasing tops. A very bearish formation.
You could also consider this as a falling wedge, a much more bullish pattern where you see a faster decline in the tops than in the bottoms, but the bottoms are still declining.
I personally find the bottoms too stable to consider this a bullish pattern and I am preparing for the scenario that the price breaks through the support and breaks down hard.
In the end, what matters most in trading is risk reward ratio and win percentage. We can see here on USD/JPY some great indicators of a bearish price continuation. However, in itself that is not enough.
I suggest to maximize the risk reward ratio by waiting for the price to be closer to the top resistance line before entering with a trade. This will allow you to get a better RRR. In this trade set-up you can see from the chart how I created a 4 RRR trade idea.
Follow me for consistent high quality updates, with clear explanations and charts.
Please like this post to support me.
- Trading Guru
--------------------------------------------------------------
Disclaimer!
This post does not provide financial advice. It is for educational purposes only!
Thảo luận về những biến động và nói cùng nhau về thị trường giao dịch ở cộng đồng Telegram này nhé!
t.me/Vietnam100eyes
(bắt đầu từ tháng 2 - 2023)
t.me/Vietnam100eyes
(bắt đầu từ tháng 2 - 2023)
Clause de non-responsabilité
Les informations et les publications ne sont pas destinées à être, et ne constituent pas, des conseils ou des recommandations en matière de finance, d'investissement, de trading ou d'autres types de conseils fournis ou approuvés par TradingView. Pour en savoir plus, consultez les Conditions d'utilisation.