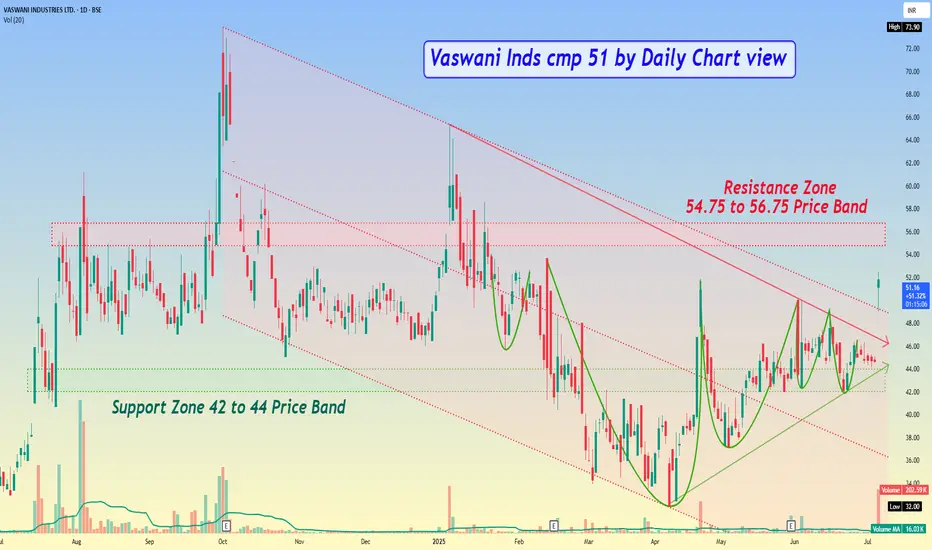
Vaswani Inds cmp 51 by Daily Chart view
- Support Zone 42 to 44 Price Band
- Resistance Zone 54.75 to 56.75 Price Band
- *Falling Parallel Price Channel Breakout done today*
- Bullish Rounding Bottoms with considerate VCP pattern too
- Heavy Volumes surge today way above average traded quantity
- *Gap Up Opening would need to be filled in and closed sooner or later on*
- *Most common Technical Indicators turning positive for BB, EMA, MACD, RSI, SAR, SuperTrend*
Clause de non-responsabilité
Les informations et publications ne sont pas destinées à être, et ne constituent pas, des conseils ou recommandations financiers, d'investissement, de trading ou autres fournis ou approuvés par TradingView. Pour en savoir plus, consultez les Conditions d'utilisation.
Clause de non-responsabilité
Les informations et publications ne sont pas destinées à être, et ne constituent pas, des conseils ou recommandations financiers, d'investissement, de trading ou autres fournis ou approuvés par TradingView. Pour en savoir plus, consultez les Conditions d'utilisation.