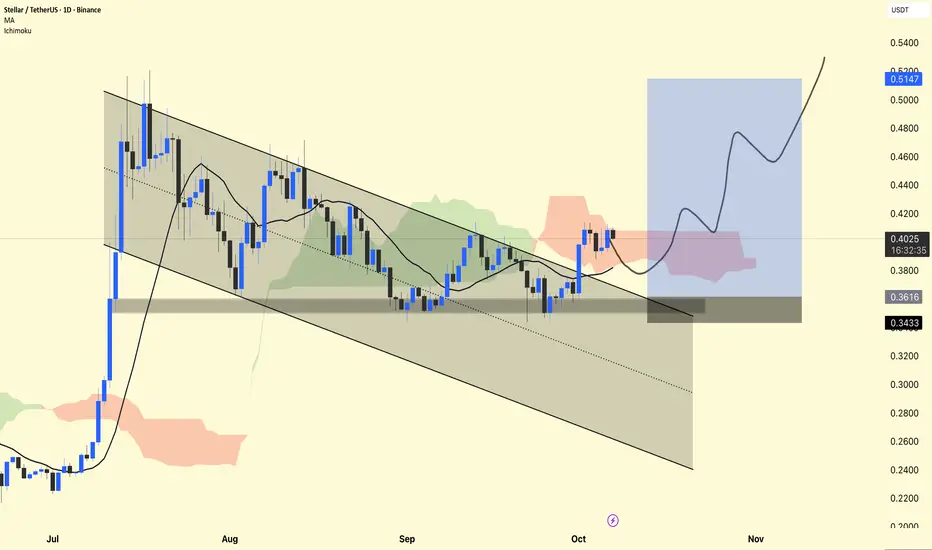
XLM/USDT — Daily Chart Analysis
The price is currently trading around $0.40, holding firmly above the demand zone ($0.36–$0.34).
The chart shows a falling channel breakout, which is a bullish reversal pattern.
The Ichimoku Cloud is showing early signs of a bullish trend as the price is attempting to hold above the cloud base.
The moving average (MA) at $0.38 is acting as dynamic support – a positive sign for further upside.
📈 Long Setup:
Entry Zone: $0.38–$0.40
Stop-Loss: Below $0.34 (clear invalidation level)
Targets:
🎯 $0.46 → First Target
🎯 $0.51 → Main Swing Target
DYOR | NFA
Publications connexes
Clause de non-responsabilité
Les informations et les publications ne sont pas destinées à être, et ne constituent pas, des conseils ou des recommandations en matière de finance, d'investissement, de trading ou d'autres types de conseils fournis ou approuvés par TradingView. Pour en savoir plus, consultez les Conditions d'utilisation.