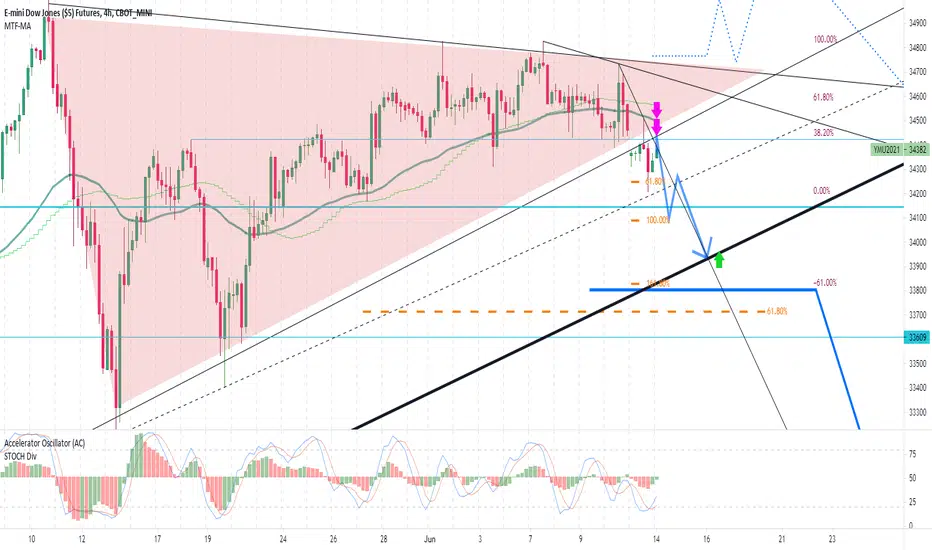
daily chart clearly show sell , we have 2 trend line in down , technical say if dowjones can break them ,down trend will start ,can go to 28500 (big gap on cash phisical dowjones)
tradingview.com/chart/jtsoM2GC/
red arrow=powerfull sellimit place with sl and trailstop= 80
green arrow=buylimit place with sl and trailstop=80
if big trend (daily chart trend line start from corona crash) near 33900 break , you can sell
tradingview.com/chart/jtsoM2GC/
red arrow=powerfull sellimit place with sl and trailstop= 80
green arrow=buylimit place with sl and trailstop=80
if big trend (daily chart trend line start from corona crash) near 33900 break , you can sell
Clause de non-responsabilité
Les informations et publications ne sont pas destinées à être, et ne constituent pas, des conseils ou recommandations financiers, d'investissement, de trading ou autres fournis ou approuvés par TradingView. Pour en savoir plus, consultez les Conditions d'utilisation.
Clause de non-responsabilité
Les informations et publications ne sont pas destinées à être, et ne constituent pas, des conseils ou recommandations financiers, d'investissement, de trading ou autres fournis ou approuvés par TradingView. Pour en savoir plus, consultez les Conditions d'utilisation.