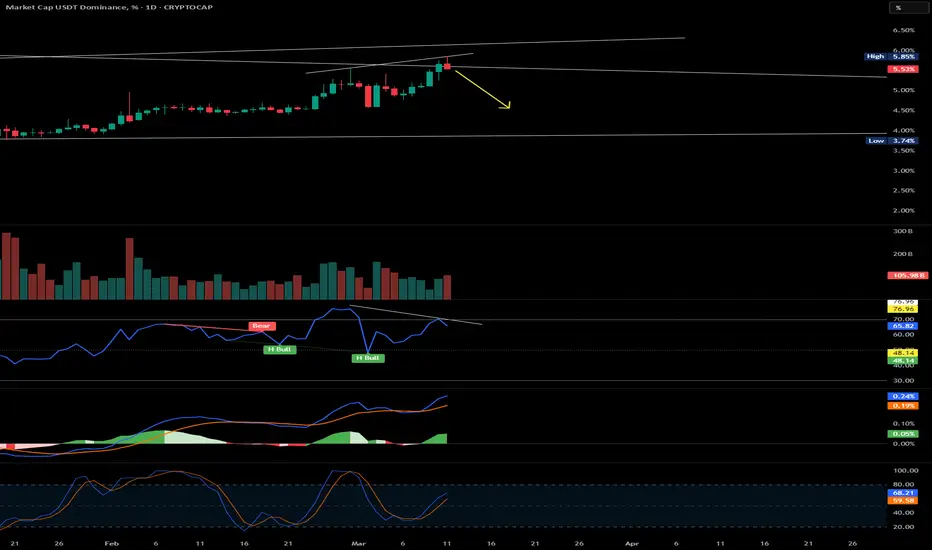
USDT Dominance Showing Bearish Divergence – Possible Crypto MarkOn the daily timeframe, USDT dominance is showing a bearish divergence:
Price Action: Higher highs
RSI: Lower highs
This indicates potential weakness in USDT dominance. However, we need today’s candle close for confirmation.
If confirmed, we could see a drop in USDT dominance from 4.5% to 3.8%, which may trigger a strong recovery in the crypto market.
Traders holding major losses may get an opportunity to reevaluate their positions. Let’s watch how this unfolds in the next 24 hours.
🔔 Stay prepared & manage risk wisely!
Bearishdivergence
$BTC Bearish Divergence on the Weekly !? NO!!!Someone on Twitter sent me a chart showing Bearish Divergence on the Weekly for BTC and asked me to analyze it.
(hopefully this link shows the chart)
pbs.twimg.com
My response is below.
---
This is a really good question!
Caught me off guard for a second and I had to really analyze it.
That chart assumes we’re at the end of the cycle, so its showing bearish divergence prematurely in Mar ’25.
But the fractal it’s being compared to shows divergence with the peak in Nov ’21.
Here’s the correct way to draw the trends.
If you draw from the bear market low to current date, you see we are just getting warmed up.
This cycle is mimicking 2017 as I’ve mentioned a lot over the past year.
I marked where we are so you can see the Feb - Mar ’21 dip in RSI.
Imagine tapping out right before the moonshot!
It’s easy to get caught off guard with that chart, as the fractals from ’21 and ’25 on the RSI do look strikingly familiar, but notice how the right shoulder on the RSI falls in Nov 21’ , but the right shoulder on the RSI in Dec ’24 is going higher, pointing to the RSI following the ’17 uptrend.
I wonder if the person who made that chart actually thought that was the correct way to analyze the chart, or if that’s just a troll bear-posting.
I could see someone like CredibleCrypto or an XRP-maxi posting that.

USDT Dominance Drop Incoming? Short-Term Relief for Crypto!📉 USDT Dominance Update 📉
USDT.D is showing bearish divergence – price rising while RSI declines. A drop from 5.42 to 4.38 is likely, giving BTC and alts a temporary relief. However, higher timeframes still look weak, so this move may not last long. Stay cautious! ⚠️

Bearish Logscale Butterfly T2 with Bearish MACD & RSI DivergenceBitcoin appears to be set up at the 1.902 HOP for a Type 2 retest of the Logscale Bearish Butterfly that resulted in a major Type 1 reaction from the 1.618 Fibonacci Extension back in 2021, where it dropped from $69,000 to $15,500 over the course of several months before ultimately bottoming at the PCZ of a smaller Log Scale Bullish Butterfly which signaled the Type 2 run up to the 1.902 HOP of the Bearish Butterfly where it is now. As it tests this level the MACD and RSI are both Diverging Bearishly and the RSI especially seems weak as it now struggles to even crack above 70 level. This signals to me that the RSI has confirmed exhaustion after divergence at the HOP and that it is likely ready to start declining further.
Saying as though this is the type 2 test, I'd suspect that we'd make a lower low than our previous Type 1 reaction low at $15k, perhaps landing us around $12-10k; but if those levels don't hold It would be technically viable to assume BTC would go for the 0.886 retrace at around $4.6k

$DXY Weekly Analysis: Bearish Divergence and Trendline Breakdown
DXY Shows Bearish Divergence and Breakdown – Bullish Implications for Bitcoin, Gold, and Forex
The U.S. Dollar Index ( TVC:DXY ) has formed a clear bearish divergence on the weekly timeframe, indicating potential downside momentum. Additionally, it has lost key trendline support, further confirming weakness in the dollar.
Key Support Levels for #DXY
Next Major Support: 102 - 100 zone
If the 110 support level is breached, DXY could experience a sharp plunge, accelerating further downside.
Bullish Impact on Bitcoin, Altcoins, Gold, and Forex
Since the DXY moves inversely to risk assets and other currencies, its bearish outlook could support:
✅ #Bitcoin & #Altcoins: Potential for upward momentum
✅ #Gold: Increased demand as a hedge against a weaker dollar
✅ #Forex Markets: Currencies like EUR, GBP, and others could gain strength against the USD
The current bearish divergence and breakdown of trendline support in DXY suggest continued dollar weakness. If key support levels fail, we could see strong rallies in Bitcoin, altcoins, gold, and major forex pairs in the coming weeks.

XRP is forming a 'potential' bearish divergence on the weekly.XRP looks to be forming a potential minor bearish divergence on the weekly chart. I still think that XRP has plenty of room to run, but we need the bullish momentum to continue in order to negate what could be a minor bearish divergence on the weekly chart.
I'm not saying that it's definitely going to form, or that it will necessarily be bearish, but it has the potential to do so. This is something that we, as traders and investors, need to be aware of and take into consideration, depending on the trades you're considering.
Just something to think about.
Good luck, and always use a stop loss!

XDC is showing a clear bearish divergence on the weekly RSI.XDC has been struggling for a long time, but like many cryptos, it benefited greatly from the 'Trump Pump' on election day. However, after a spectacular run, XDC is now showing a clear bearish divergence on the weekly RSI.
Could this spell disaster for the price of XDC? Only time will tell, but I would exercise caution here if you are considering a long position.
Good luck, and always use a stop loss!

BITCOIN - Time to be Bearish!The 3-day chart shows a bearish divergence on the RSI indicator.
-A bearish divergence occurs when:
1. Price Action: The asset's price forms higher highs (uptrend).
2. RSI Indicator: The RSI forms lower highs instead of following the price
This divergence suggests that the upward momentum is weakening, even though the price is climbing, which could lead to a potential downtrend or correction.
Based on this a drop to the 80k region is expected, which aligns with the 0.618 Fibonacci level.
This decline perfectly corresponds to the fourth wave of the Elliott Impulse Wave.
Afterward, a significant recovery is expected, representing Bitcoin's final bullish wave in the Elliott Wave cycle (the fifth wave)
My outlook for the chart suggests a decline starting now and lasting until mid-February at most
Best regards Ceciliones🎯

Reversal Trading Strategy Using GOLDEN RSI Divergence Indicator Overview
Reversal trading strategies capitalize on identifying turning points in the market where a potential reversal from a downtrend to an uptrend, or vice versa, occurs. In this post, I will introduce a strategy based on divergence patterns spotted with a custom RSI (Relative Strength Index) indicator.
This method enhances traditional RSI analysis by making divergence detection clearer and actionable. By combining it with a strong understanding of price action, traders can gain an edge in timing market reversals effectively.
Key Features of This Strategy
Divergence Analysis: The core of this strategy is to identify bullish or bearish divergences between the RSI and price action.
Custom RSI Indicator: The custom RSI indicator simplifies divergence detection by highlighting critical levels and marking divergence points directly on the chart.
Confluence with Price Action: Reversals are validated using trendlines, support/resistance zones, and candlestick patterns.
Chart Example: S&P 500 Index
In the attached chart:
Bullish Divergence:
The price made lower lows, while the RSI made higher lows (indicated by green arrows).
This divergence signaled weakening bearish momentum and potential reversal.
Entry Point:
A clear breakout above the trendline validated the reversal.
Enter long positions near this breakout level.
Stop Loss:
Place the stop loss just below the recent swing low.
Target Profit:
Aim for the next major resistance zone or use a fixed risk-reward ratio (e.g., 1:2 or 1:3).
How to Spot Divergence
Bullish Divergence:
Price forms lower lows.
RSI forms higher lows.
This indicates waning bearish pressure and a potential upward reversal.
Bearish Divergence:
Price forms higher highs.
RSI forms lower highs.
This suggests weakening bullish pressure and a possible downward reversal.
Why This Strategy Works
Strength of RSI Divergence
RSI divergence reflects the loss of momentum in the current trend. By detecting it early, traders can position themselves ahead of major reversals.
Combining Confluence Factors
The success rate of this strategy increases when RSI divergence aligns with other technical factors like:
Horizontal support or resistance levels.
Trendline breaks.
Volume spikes.
Practical Tips for Using This Strategy
Use Multiple Timeframes: Confirm divergence signals on higher timeframes for stronger setups.
Avoid Overtrading: Only act on clear and validated divergence setups to minimize false signals.
Risk Management: Never risk more than 1-2% of your trading capital on a single trade.
Conclusion
This custom RSI-based divergence strategy is a powerful tool to identify high-probability reversal setups. When combined with proper risk management and confluence analysis, it can significantly improve trading outcomes.
Start experimenting with this strategy on your demo account and refine your approach before deploying it in live markets. If you have questions or want to discuss this further, feel free to comment below!

$BTC Bearish Divergence on 4HRClear Bearish Divergence on the CRYPTOCAP:BTC 4HR
Notice price going up, with the RSI and Volume going down.
Price should start to topple at this $103,5 level.
Plan accordingly.

DOGEUSDT ChartThere is Bearish Divergence also reversal Pattern of Double Top. Will Take sell entry at the breakdown of Neckline.

XRP ChartThere is Bearish Divergence and Also Pattern of Double Top. Will take Sell entry at the breakdown of Neckline


GOLD ChartThere is Bullish momentum. But there is Bearish divergence and also have the Trend reversal pattern of Double Top. So, will take Sell entry at Breakdown of the Neckline and Stoploss at Few pips above double top.

USDCAD ChartThere is Bullish Trend but have bearish divergence also reversal pattern of Rising Wedge. So, I am bearish bias in this setup. Wait for the breakdown of last HL i.e. 1.38110. then take sell entry putting SL on 1.39100.

Technical Analysis: EURNZD Bearish ButterflyHello Traders,
Below is my Technical Analysis of EURNZD.
EURNZD has formed a bearish butterfly pattern with points X: 1.79369, A: 1.7442, B: 1.78702, C: 1.76273, D: 1.80786. The current price is 1.80379. Expectation for a drop to 1.78808 in the coming weeks. Additionally, a bearish divergence is noted on the Awesome Oscillator, indicating weakening bullish momentum.
Cheers and Happy Trading.

USDCAD ChartUSDCAD Chart
There is Bullish trend but we observe bearish divergence, So we open sell trade at the (BOS) i.e break of last HL

NZDCAD ChartThere is Bullish Trend, But RSI forms Bearish Divergence and also there is Bearish Pattern of Double Top. Will Take Short entry at the Break of last HL. Trade Plan According to this Analysis and my Risk Reward.

Dixon Tech., Fake-Breakout in Daily with Bearish DivergencesDixon Technologies, Fake-Breakout with Bearish Divergence in Daily Timeframe, Shows a possible reversal of a Bullish Trend into Bearish Trend with following possible targets
CMP - 12614
T1 - 12000
T2 - 10800
Stop Loss - 12885

#GER30 bearish continuation moveAfter an impulsive bearish move in the GER30 last week, the price is now forming a bullish corrective move and a rising wedge pattern, which typically has a bearish bias.
Additionally, the price has reached the 1-hour 200 EMA, which could act as dynamic resistance. There's also a bearish divergence between the price and the momentum oscillator on this timeframe.
These factors together suggest a bearish outlook.

#GBPCAD bearish scenarioBearish divergence in the 4H timeframe, as well as price failing to create a new high, shows potential weakness in the uptrend.
Furthermore, from an Elliott wave perspective, it seems like we are at wave 5 of 5, with a high potential for a bearish move from here.
In the 1H timeframe, we can see that the price managed to break below the previous higher low, successfully changing the structure towards bearish in the 1H timeframe.
Let me know if you would like me to publish an analysis in a lower timeframe on this chart to take advantage of this rally.

#AUDNZD bearish move possibilityAs can be seen in the chart, we have bearish divergence in the 4H and daily timeframes, suggesting that the price might have reached the end of its bullish move.
Furthermore, in the 1H timeframe, the price has managed to shift market structure towards bearish by breaking below the previous higher low. Now, the price seems to be completing a pullback to the broken short-term trendline and previous support zone, which now act as resistance.
Let me know if you would like me to publish an analysis in a lower timeframe on this chart to take advantage of this rally.

GBPNZD - Bearish Breakout + DivergenceTaking a look at the 1 hour timeframe, it's quite noticable that we have a clean breakout to the downside along with bearish divergence with RSI.
This isn't much of a surprise as this pair is heavily overbought on the daily and weekly timeframes.
Next week we get the latest policy decision from the BOE which likely will contribute to stirling weakness heading into the meeting.
