Le Break-Even : Votre ange gardien ou votre pire ennemi ?Le Break-Even (BE), c'est ce moment magique où l'on déplace son Stop Loss au niveau de son prix d'entrée. Risque zéro. Sécurité totale. Enfin... en théorie.
Le piège psychologique
Il n'y a rien de plus réconfortant que de mettre son trade à BE. Mais il n'y a rien de plus frustrant que de se faire sortir "à zéro" juste avant de voir le marché s'envoler vers notre Take Profit.
L'erreur classique : Passer à BE trop tôt par simple peur de perdre. Le marché se moque de votre prix d'entrée ; il a besoin de respirer. En étouffant votre trade, vous transformez souvent des positions gagnantes en opportunités manquées.
3 stratégies pour un BE intelligent
Pour que le BE soit un outil et non une béquille émotionnelle, il doit être systématique :
1. La distance fixe : On ne passe à BE que lorsque le prix a atteint un certain objectif intermédiaire, par exemple un Ratio Risque/Récompense de 1:1. Simple, clair, objectif.
2. La structure du prix : C’est la méthode la plus technique. On attend que le marché crée une nouvelle structure (un nouveau "creux" ou "sommet") pour protéger sa position derrière ce nouveau rempart.
3. L'assistance technique : Utiliser des indicateurs de tendance comme les plats de Kijun (Ichimoku) ou le SAR Parabolique pour ne citer qu’eux.
Un outil à double tranchant
Le Break-Even procure la meilleure sensation possible : l'invincibilité. Mais sans une stratégie de sortie rigoureuse, c'est aussi le meilleur moyen de saboter vos statistiques à long terme.
Ne laissez pas votre peur décider de votre gestion de risque . Intégrez le BE dans votre plan, backtestez-le, et respectez-le.
Volatilité
Acwi / cw8 : cassure par le hautEn cette fin d'année, le rally fait son chemin et casse une oblique baissiere par le haut validant la sortie de tendance neutre et le retour en tendance haussiere..
Le manque de volume du jour +le RSI haussier mais sans casser les 60 semble informer d'une petite correction a venir pour reprendre un peu de force et offrir un potentiel signal d'achat.
A suivre donc 😉🚀

2222 vise les sommets du canalL’action vient d’afficher un mouvement très fort des acheteurs, marquant une impulsion notable sur le graphique — un signe technique fort qui suggère que le titre pourrait viser à nouveau les sommets de son couloir haussier.
🔎 Pourquoi ce mouvement est-il encourageant ?
✅ Reprise acheteuse visible : Un volume accru accompagne la poussée, ce qui valide l’intérêt des investisseurs.
✅ Structure graphique en place : Le titre évolue dans un canal haussier bien défini, et ce rebond dessine un potentiel retour vers la partie haute de ce canal.
✅ Momentum relancé : Après une période d’accalmie ou de consolidation, la dynamique s’inverse à la faveur des acheteurs.
✅ Potentiel de cible claire : Si la tendance se confirme, le marché pourrait viser les plus hauts précédents du couloir, maintenant à portée.
📊 Scénario possible : Tant que l’action reste engagée dans ce mouvement impulsif et que le support du canal tient, la trajectoire vers les sommets est plausible. Un léger retrait technique est possible, mais le biais reste positif.
💬 Nouveau rallye en vue pour 2222 ? 🤔
#StockMarket #Trading #2222 #Bourse #AnalyseTech #Investissement

Analyse - USELESS_COIN : entrée potentielle sur zone technique !🔍 À propos du token :
Useless Coin est un nouveau memecoin qui attire l'attention sur les volumes récents.
Projet jeune, son positionnement est volontairement "auto-dérisoire", mais il affiche déjà une market cap >200M$, preuve de traction sur la communauté crypto.
Côté structure, il évolue désormais dans une phase post-hype où les acheteurs tentent de défendre plusieurs zones techniques clés. Cela crée un cadre propice à une entrée stratégique à court terme.
📊 Analyse technique (2H) :
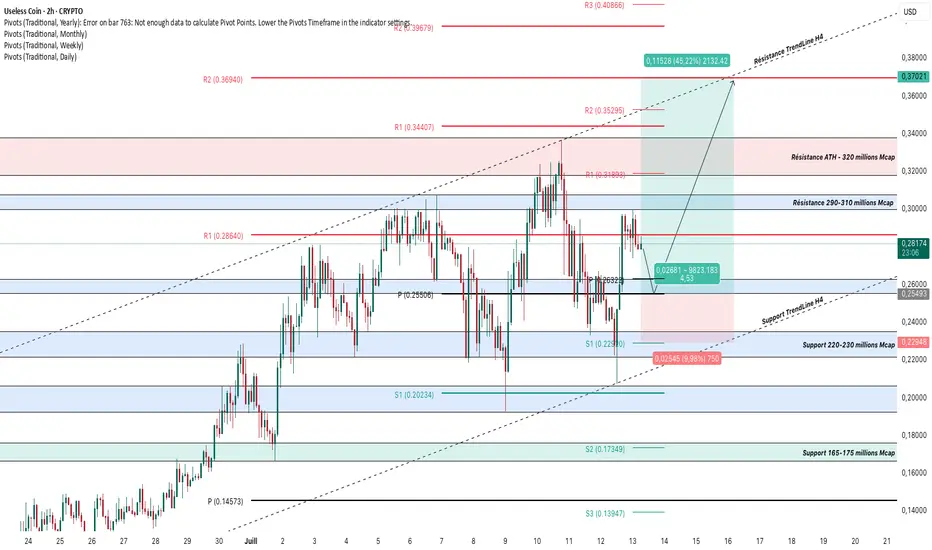
Le token évolue dans un canal haussier H4, mais consolide sous deux niveaux clés : $0.286 (R1 Weekly) et la résistance des 290–310M$ Mcap.
🟦 Zone d’entrée potentielle : $0.254 – $0.263
Cette zone regroupe plusieurs éléments techniques :
Support horizontal validé plusieurs fois
Ancien pivot H4
Niveau psychologique intermédiaire :
Support dynamique en approche (trendline H4)
👉 C’est là que je positionnerai ma future entrée longue.
🔴 Stop loss : $0.229
Juste sous la zone de support Mcap 220–230M$
Correspond à un repli de -9.98%
✅ Take profit : $0.370
Résistance H4 + trendline haute du canal
Zone R2 mensuelle
Correspond à un potentiel de +45.22%
Ratio R/R ≈ 4.5
📌 Zones techniques à surveiller :
🔽 Zone support H4 : $0.229 – $0.254
🔼 Zone résistance intermédiaire : $0.286 – $0.318
🔺 Zone résistance finale / TP : $0.344 – $0.370
🔝 ATH / zone extrême : $0.396 – $0.408
🔧 Pivots :
Pivot weekly : $0.255
S1 : $0.202
S2 : $0.173
S3 : $0.139
🧭 Conclusion :
Useless Coin consolide sous une résistance majeure.
La zone $0.254–$0.263 offre un setup propre pour entrer avec un bon ratio R/R et un stop contrôlé.
Si le marché valide un rebond ici, le target à $0.370 est crédible, avec potentiellement un retour dans le haut de canal vers l’ATH.
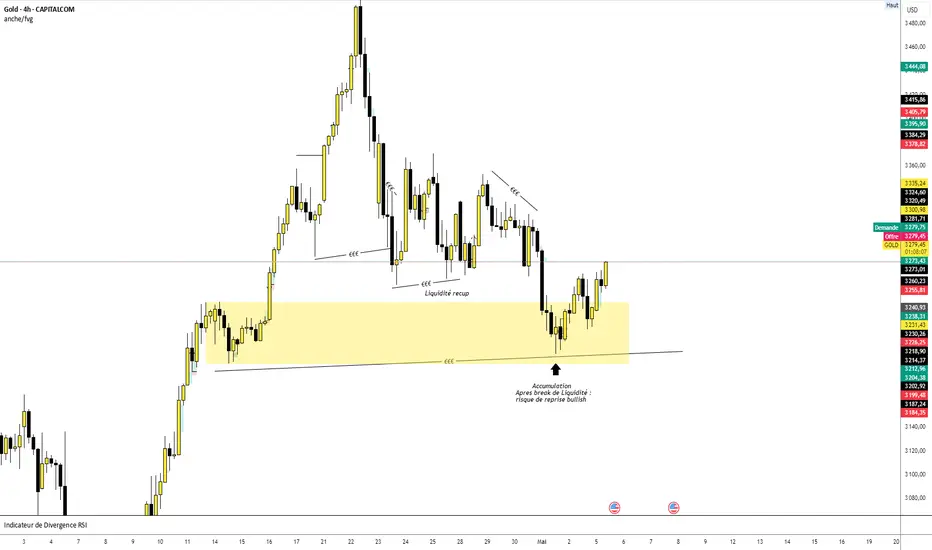
Reprise Bullish ? Le Gold a fond 1Actuellement, le gold a cassé une zone de liquidité importante. Suite à ce break, je l’attendais dans une zone d’order block, ce qu’il a bien respecté. Pour l’instant, il n’y a pas eu de réelle phase d’accumulation, mais le prix est revenu exactement là où je l’attendais.
Je surveille désormais une possible reprise haussière. Toutefois, la tendance H4 reste bearish, donc prudence. Le daily, en revanche, reste haussier, ce qui renforce mon biais acheteur.
Mon scénario principal : une reprise vers une zone de liquidité proche, autour des 3354.
Scénario alternatif : si le prix échoue, je m’attends à un nouveau break de la liquidité formée en daily.
Update Gold – Confirmation du plan
Le gold a réagi parfaitement dans le magnifique BI OB H4 identifié.
Comme prévu, il a ensuite lancé une belle poussée haussière.
Le plan est respecté à la lettre.
Le daily reste haussier, et le prix montre de la force.
Patience maintenant : on laisse respirer le marché.
📈 Go long sur confirmation – tout est en place.
si besoin de + d'info go me dm
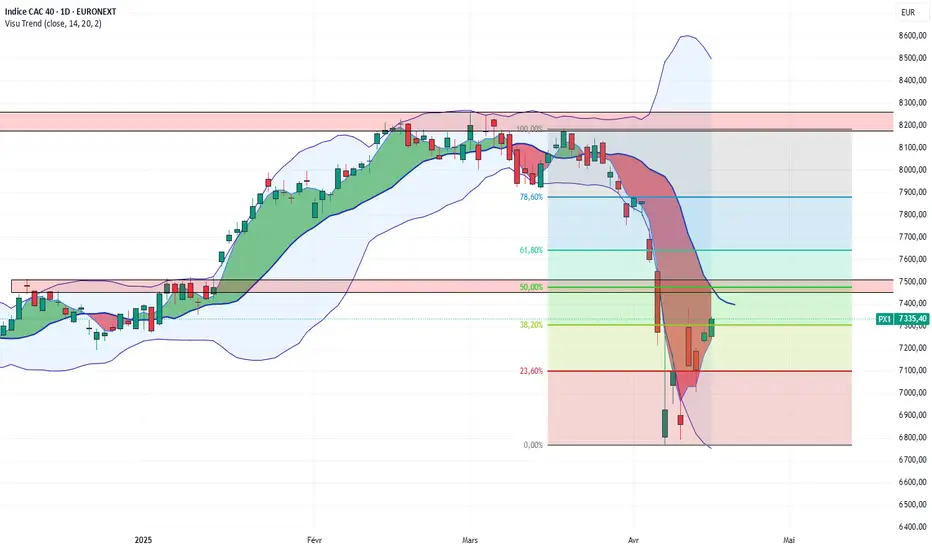
Le CAC40 reste toujours en rebond technique et baissierLe CAC40 nous offre un beau rebond technique avec l'apaisement "provisoire" des tensions commerciales.
Le prix revient sur une zone importante à surveiller pour la suite de ce rebond.
Cette zone c'est celle des 7400 - 7460 points.
Cela correspond à la frontière de notre indicateur pour repasser en territoire haussier mais aussi des 50% de retracement des Fibonacci.
Maintenant mon hypothèse est que j'anticipe quand même une réaction sur ces niveaux, surtout que la volatilité reste élevée avec des bandes de Bollinger toujours orientées à la baisse.
Un échec ne serait pas surprenant voir même rassurant pour la suite.
Comme je l'enseigne des mes différents cours sur mon site internet cela permet au prix de construire une base avec des niveaux chartistes tangibles sur le graphique.
Pour le moment nous n'en sommes pas encore là, j'aurai le temps d'affiner avec vous cette analyse.
Solana dans un biseau descendant. On guette sa sortieLa tendance sur Solana est devenue baissière depuis le 10 février 2025 avec la cassure à la baisse du niveau des 180$ et le scandale argentin Libra.
Ce niveau avait été travaillé depuis mai 2024, d'abord en résistance puis en support.
Nous avons eu droit à un pull back sous ce niveau pour valider cette cassure (principe du changement de polarité en analyse graphique).
Ensuite tout s'est accéléré avec la chute des marchés qui a tout emporté.
Le gros niveau moyen - long terme se situe sur la zone des 90 - 80$. Le prix a d'ailleurs fait une mèche basse dessus cette semaine avant de rebondir. Cela confirme malgré tout que des acheteurs restent présent.
Maintenant cette chute se construit à l'intérieur d'un biseau descendant. C'est une figure chartiste qui se casse statiquement par le haut.
On surveille en premier le niveau des 125$ pour commencer à entrevoir du mieux à moyen terme. A noter que la volatilité avec les bandes de Bollinger restent en encore élevée.
L'objectif graphique immédiate en cas de cassure à la hausse des 125$ serait la zone des 150$.
Pour le moment nous n'y sommes pas, mais à suivre

Buy GBPUSDLe marché est venue ramasser les EQL et d’après moi ça va également prendre le FVG avant de repartir à la hausse

BTC Rebond en H1On part dans une logique de rebond comme je les aimes avec une entrée sur la bougie d'avalement et un SL sur la méché de la précédente bougie.

ETH montre un signe de force maisDepuis ce week-end ETH montre des signes de force mais il n'est :
- pas créé de Divergences sur le RSI
-pas revenu sur sa zone OTE
Dans un scénario bull il viendrait juste chercher sa liquidité dans la zone OTE h4 (en vert) pour repartir!
Dans un scénario plus bear il pourrait revenir toucher la droite de tendance haussière qui correspond également à une zone OTE Weekly

UTK un joli pumpUn jolie pump de 95% au moment ou j'écris ce topo... Si quelqu'un a de l'info; je suis preneur :)
Nous allons voir si le UTK garde le régime en 4H

Compression sur CorgiAIOn peu remarquer un triangle de compression de la volatilité sur le cours du CorgiAI, la tendance est à la hausse, il y a du volume et le RSI montre une divergence Bull... Avec le mood general des crypto (BTC a 100k) je crois qu'on peux s'attendre une hausse sur ce jeton aussi.
CLong

Suivi du KARRATJ'ai apposé les lignes jaunes une dizaines de jours avant. en Weekly, mais je n'aurais pas cru à une résolution aussi précise du triangle.

Compression de la volatilité sur KARRATBelle exemple de la compression de la volatilité, cassure à la hausse en daily, belle performance

Un nouveau plus haut historique pour Morgan Stanley ! Interprétation de la performance actuelle :
Tendance haussière :
L'action évolue dans un canal haussier (indiqué en bleu) qui montre une nette progression depuis plusieurs mois, avec un rebond sur les supports et une rupture de résistances.
Niveaux de prix :
L'action a franchi plusieurs résistances importantes (R1 à 106.35 $, R2 à 112.21 $).
Elle se situe actuellement autour des 120 $, proche du niveau de résistance marqué comme Nouveau plus haut historique 2024 à 119.46 $.
Elle évolue deja au dessus de la R3 annuelle.
Moyennes mobiles :
Les moyennes mobiles exponentielles (EMA) à 50, 100, et 200 périodes sont toutes en dessous du prix actuel, indiquant un soutien technique fort et une tendance haussière durable.
Objectifs futurs :
Objectif de prix futur (R3 annuel) : La prochaine résistance majeure est indiquée à 137.92 $, correspondant à un objectif de prix ambitieux si la tendance se poursuit.
Conclusion :
La super performance de MS est clairement visible avec un franchissement de plusieurs niveaux clés.
À court terme, la résistance à 120 $ pourrait jouer un rôle important. Si ce niveau est franchi avec un volume élevé, le prix pourrait se diriger vers l'objectif R3 annuel à 137.92 $.
L'action montre une dynamique très haussière, mais une consolidation autour des niveaux actuels est possible avant une nouvelle montée. Les investisseurs devraient surveiller de près ces zones clés.

GLE : Société général , Squezze et double scénarioRésumé :
-> Voir tout alerte de sortie de squezze
-> Sortie baissière : TP 17.33 (-19%)
-> Sortie Haussière : TP 25.67 (+17%)
Setup :
Analyse Daily , projection d'éventail fibo , BB (SMA 20 , X2) , BBW (Volatilité) , Indicateur d'intensité + %b (Volumes et Prix)
Sentiment : Prise de position "long" , double gap à combler mais prudence car Structure de prix baissier (Sous Théorie de Dow) et pas de ChocH . Indicateurs d'intensité en chute de force pour les vendeurs -> Sell off ?
Stratégie : Prendre position sur sortie de Squezze (Rupture BBW) et atteinte Borne (sup/inf) pour orientation (attention, ne prendre qu'une demi-position pour limiter les pertes sur headFake ! reprise de la position suivante sur le Choch)
Rappel : La volatilité est cyclique...
Ceci est une analyse personnelle, partagez-moi votre opinion

L'Oreal (OR) : Analyse TechniqueL'analyse technique de L'Oréal (OR) met en évidence un signal de vente important généré le 27 juin par l'indicateur "Price Excess with Adjustable Recovery". Cet outil innovant, conçu pour identifier les mouvements de prix excessifs, a correctement anticipé la correction qui a suivi, entraînant une baisse de plus de 6% du cours de l'action depuis ce signal. La pertinence de cette indication est renforcée par l'ADX (Average Directional Index), qui affiche un niveau élevé de 31, confirmant la présence d'une forte tendance baissière.
Actuellement, le titre se négocie autour de 414 EUR, à proximité d'un support important situé à 411 EUR. Cette zone de support pourrait potentiellement ralentir la baisse, voire provoquer un rebond technique à court terme. La force de la tendance baissière, confirmée par l'ADX, suggère que ce support pourrait être mis à l'épreuve dans les prochaines séances. Cependant, il est crucial de noter que si l'indicateur "Price Excess with Adjustable Recovery" venait à générer un signal d'achat prochainement, cela renforcerait considérablement l'idée d'un possible rebond du prix sur ce support à 411 EUR.
L'efficacité démontrée par le "Price Excess with Adjustable Recovery" lors du signal de vente du 27 juin souligne sa pertinence pour anticiper les retournements de tendance significatifs. Sa capacité à détecter les excès de marché, combinée à la confirmation de l'ADX, en fait un outil précieux pour les traders et les investisseurs cherchant à optimiser leurs points d'entrée et de sortie. Dans le contexte actuel, un éventuel signal d'achat de cet indicateur pourrait être particulièrement significatif, offrant potentiellement une opportunité d'entrée intéressante pour les investisseurs attentifs.

C'est chaud pour le HOT!Selon une analyse de la tendance plutôt sommaire, je crois que le LSE:HOT pourrais nous taper un beau rally haussier a son tour. plusieurs indicateurs me pousse à y croire.
#altseason

ADYEN Consolidation en cours
Scénario de retournement de tendance toujours valide, le titre consolide. Après une reprise du titre sur zone d'excès basse (faisant suite à profit warning) Adyen a repris fortement sa hausse sur un gap de rupture.
Adyen se trouve actuellement dans son gap baissier du 17 août dernier qui n'est pas encore comblé.
Tendance :
Elle reste neutre sur l'unité supérieure (W) ce qui plaide en faveur d'un travail des unités courtes pour tenter de la retourner à la hausse.
Tendance Daily est passée haussière suite au récent Trend.
Les unités inférieures restent neutres.
Volatilité :
BB restent baissières. Le titre s'est repris et a franchi la zone d''équilibre
BB basse est à plat. Pas de retournement en cours pour le moment
Volumes :
Les échanges restent positifs. Les acheteurs sont toujours présents sur cette timeframe
Vitesse :
La vitesse du Trend sur les 10 dernières périodes est légèrement négative. La consolidation est peu profond. Au plus fort de son trend récent elle était à 76/100 ce qui est très rapide.
Force :
La force du trend reste toujours élevée (au-dessus de 250). Elle était, au plus fort du récent trend haussier à 676 (sur 1000)
Momentum :
Selon le scénario de retournement, la tendance weekly est actuellement travaillée. Il faut donc rechercher un signal long sur les unités H2 ou H4.
A noter : Une oblique D bloque actuellement les cours.
Conclusion :
Le scénario de retournement (objectif borne haute) n'est toujours pas invalidé. Tant que la tendance Daily ne se passe pas baissière, il reste valide.
Je surveille donc : Un signal haussier en H2 pour un meilleur R/R, voire H4
Invalidation : Sous 1010, ce scénario ne sera, selon moi, plus valide.

Air France - Redécollage imminent - Imminent takeoffEURONEXT:AF
Attention: Les positions sont susceptibles d'évoluer tous les jours
ceci n'est pas un conseil en investissement.
ADX amorce une baisse : fin de la force vendeuse depuis juin
Les DI se croisent : les investisseurs reprennent le dessus
STOCHRSI en hausse : rebond acheteur a court terme , cela n'exclue pas un pull back a 10.9
Objectifs de cours : 13.2 puis 14.0 puis 15.6
Ichimoku : Nous restons sous le nuage mais la cassure des 11.9 est un signal bullish non négligeable (chiku)
Attention: Positions are subject to change every day.
This is not investment advice.
ADX is starting a decline: end of the selling pressure since June.
The DIs are crossing: investors are taking over.
STOCHRSI is rising: short-term buying rebound, which doesn't exclude a pullback to 10.9.
Price targets: 13.2 then 14.0 then 15.6.
Ichimoku: We remain below the cloud, but the breakout at 11.9 is a significant bullish signal (chiku).

Orange double bottomCassure de la ligne de coup validé sur double bottom
Mm200 daily maintenu
Clôture au dessus des bandes de Bollinger
Volume du jour important (mais pas ouf non plus)
Validation de la divergence haussière du RSI
Support haussier (40) préservé sur RSI daily
Je rentre une petite position en espérant un retracement pour re h1rger un peu plus bas

AtosValidation de la tendance haussière court terme.
Rebond sur oblique ascendante moyen terme.
Je rentre à la cassure du range (et clôture en dehors des bandes de bollinger) et je rechargerai si on vient faire un pull black.
Stop sous les plus bas.
Tp1 avec rrr =1 to2 uniquement avec un stop suiveur

Gbp/aud Comme convenu sur mon analyse d hier nous somme bien revenue retracer le dernier mouvement h4 au niveau des 61.8 avec un beau rr pris sur la descente ,
Buy set up m15 valider pour continuation haussière + backround vert + clôture bougie au dessus de la sma + volume au dessus de la moyenne
Indicateur non repaint contrairement à beaucoup d indicateur et utilisable sur tous les actifs et toutes les Time frame , n hésitez pas si vous avez des question 👀
