OPEN-SOURCE SCRIPT
Saturn Retrograde Periods
Saturn Retrograde Periods Visualizer for TradingView
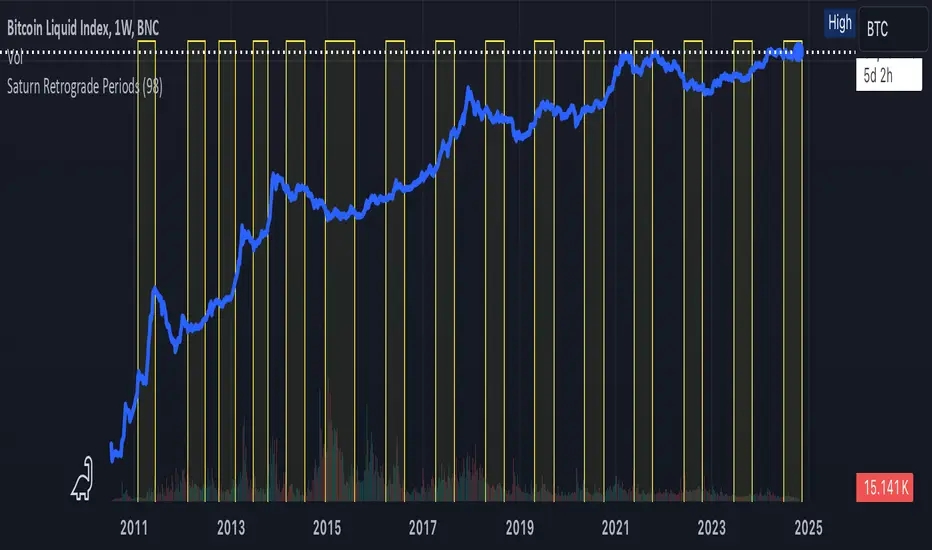
This Pine Script visualizes all Saturn retrograde periods since 2009, including the current retrograde ending on November 15, 2024. The script overlays yellow boxes on your TradingView chart to highlight the exact periods of Saturn retrograde. It's a great tool for astrologically-inclined traders or those interested in market timing based on astrological events.
Key Features:
Full Historical Coverage: Displays Saturn retrograde periods from 2009 (the inception of Bitcoin) to the current retrograde ending in November 2024.
Customizable Appearance: You can easily adjust the color and opacity of the boxes directly from the script's settings window, making it flexible for various chart styles.
Visual Clarity: The boxes span the full vertical range of your chart, ensuring the retrograde periods are clearly visible over any asset, timeframe, or price action.
How to Use:
Add the script to your TradingView chart.
Adjust the color and opacity in the settings to suit your preferences.
View all relevant Saturn retrograde periods and analyze how these astrological events may align with price movements in your selected asset.
This script is perfect for traders and analysts who want to combine astrology with financial market analysis!
scripted by chat.gpt - version 1.0
Script open-source
Dans l'esprit TradingView, le créateur de ce script l'a rendu open source afin que les traders puissent examiner et vérifier ses fonctionnalités. Bravo à l'auteur! Bien que vous puissiez l'utiliser gratuitement, n'oubliez pas que la republication du code est soumise à nos Règles.
Clause de non-responsabilité
Les informations et publications ne sont pas destinées à être, et ne constituent pas, des conseils ou recommandations financiers, d'investissement, de trading ou autres fournis ou approuvés par TradingView. Pour en savoir plus, consultez les Conditions d'utilisation.