PROTECTED SOURCE SCRIPT
Mis à jour Order Flow Analysis
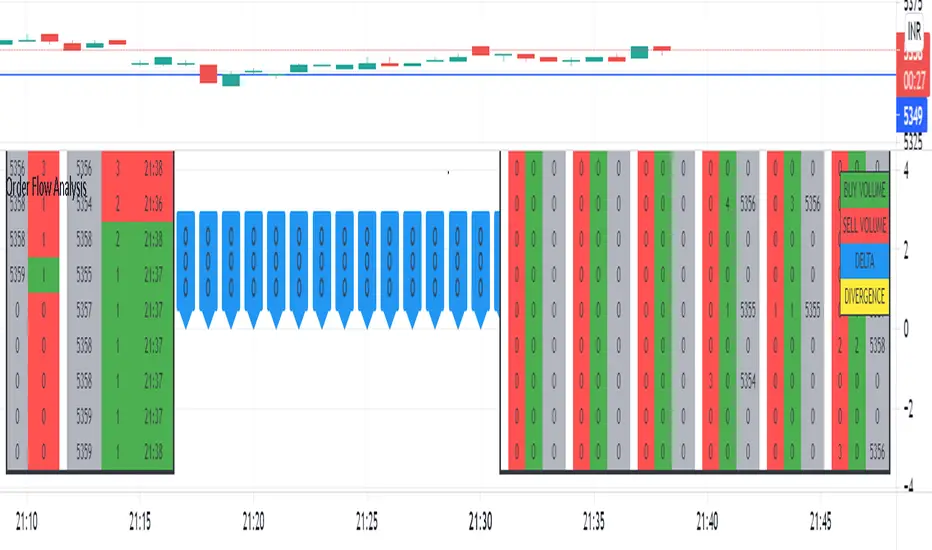
The script plots the order flow clusters for the last six candles in the middle right.
The cluster contains buy volume, sell volume and the price range of the volume.
It calculates uptick volume as buy volume and down tick volume as sell volume and calculates the delta(shown in labels). Recent ATR is considered to determine each cell price range in the cluster.
At the left side, the top volume ticks and the live ticks are displayed.
Please note this works only during market trading hours.
Do not refresh the browser tab and do not change the timeframe, which will cause a reset of numbers.
Notes de version
Delta divergences are shown in labels with yellow color. Labels are present at 0 price.Please scroll and zoom to get the delta labels.Minor enhancements and bug fixes.
Notes de version
Minor enhancements.Notes de version
converted to V5The delta bars now overlay on the chart ( can also be separated into new pane below)
Delta bars size, font size, color and number of required bars can be changed
minor improvements and fixes
Delta labels will be aligned automatically below day's low with an offset that can be changed.
Script protégé
Ce script est publié en source fermée. Cependant, vous pouvez l'utiliser librement et sans aucune restriction – pour en savoir plus, cliquez ici.
Clause de non-responsabilité
Les informations et publications ne sont pas destinées à être, et ne constituent pas, des conseils ou recommandations financiers, d'investissement, de trading ou autres fournis ou approuvés par TradingView. Pour en savoir plus, consultez les Conditions d'utilisation.