Tape Speed
The indicator will begin loading ticks for the duration of the specified longer term averaging period.
ex: If the indicator is set to have a long term average of 10min, you must run the indicator for 10min first for it to begin its averaging process.
When the required duration of ticks have loaded, it will display the average time elapsed between each tick during that time.
It will also continue to read incoming ticks and calculate new averages once the initial load is finished.
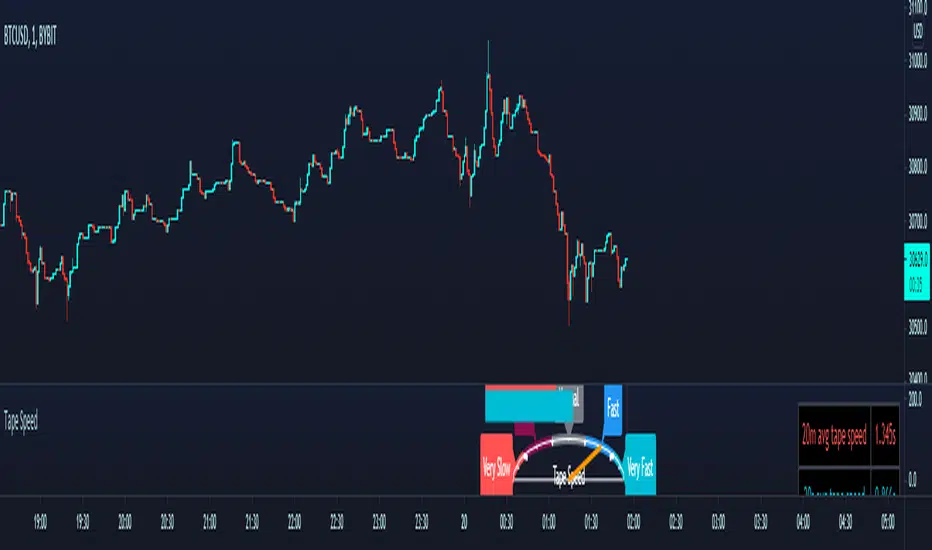
The longer term average is displayed as a static red horizontal bar, the entire speedomter gauge, and the value is also explicitly stated in the top right corner with the table.
The blue bar, the needle, and the bottom row of the table are all representations of the shorter term period's average time between ticks.
The shorter term average is compared against the longer term average to determine whether the short term incoming orders are coming in more aggressively/less aggressively or normally compared to the longer period's average.
___________________________________________________________
Thanks to user rumpypumpydumpy for giving me permission to use his semicircle logic from his "Speedometer Toolbox" to display my own data.

Script sur invitation seulement
Seuls les utilisateurs approuvés par l'auteur peuvent accéder à ce script. Vous devrez demander et obtenir l'autorisation pour l'utiliser. Celle-ci est généralement accordée après paiement. Pour plus de détails, suivez les instructions de l'auteur ci-dessous ou contactez directement Chonky_.
TradingView ne recommande PAS d'acheter ou d'utiliser un script à moins que vous ne fassiez entièrement confiance à son auteur et que vous compreniez son fonctionnement. Vous pouvez également trouver des alternatives gratuites et open source dans nos scripts communautaires.
Instructions de l'auteur
Clause de non-responsabilité
Script sur invitation seulement
Seuls les utilisateurs approuvés par l'auteur peuvent accéder à ce script. Vous devrez demander et obtenir l'autorisation pour l'utiliser. Celle-ci est généralement accordée après paiement. Pour plus de détails, suivez les instructions de l'auteur ci-dessous ou contactez directement Chonky_.
TradingView ne recommande PAS d'acheter ou d'utiliser un script à moins que vous ne fassiez entièrement confiance à son auteur et que vous compreniez son fonctionnement. Vous pouvez également trouver des alternatives gratuites et open source dans nos scripts communautaires.