OPEN-SOURCE SCRIPT
0.382 Fibonacci Line of Trailing 1-year Price Range
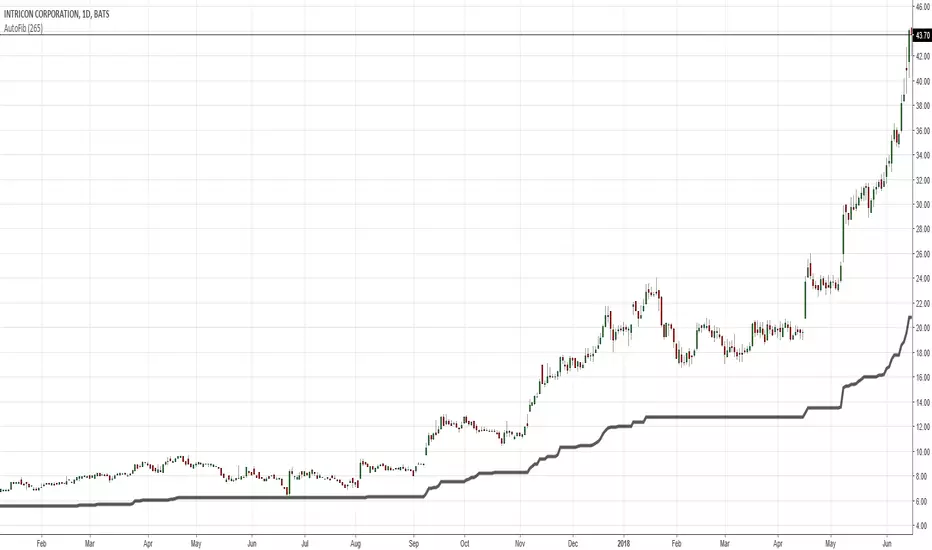
You may try adding this Line to your daily charts. It represents the 0.382 Fibonacci level of the trailing 1-year Price Range.
If price is above this line, then it is in Bullish Territory and long entries can be looked for.
According to backtesting I've done, price being above the 0.382 Fibonacci and/or the 200d sma are the 2 best determinants of
qualifying an equity to be in Bullish Territory on the daily chart.
If price is above this line, then it is in Bullish Territory and long entries can be looked for.
According to backtesting I've done, price being above the 0.382 Fibonacci and/or the 200d sma are the 2 best determinants of
qualifying an equity to be in Bullish Territory on the daily chart.
Script open-source
Dans l'esprit TradingView, le créateur de ce script l'a rendu open source afin que les traders puissent examiner et vérifier ses fonctionnalités. Bravo à l'auteur! Bien que vous puissiez l'utiliser gratuitement, n'oubliez pas que la republication du code est soumise à nos Règles.
Clause de non-responsabilité
Les informations et publications ne sont pas destinées à être, et ne constituent pas, des conseils ou recommandations financiers, d'investissement, de trading ou autres fournis ou approuvés par TradingView. Pour en savoir plus, consultez les Conditions d'utilisation.