OPEN-SOURCE SCRIPT
M-Oscillator
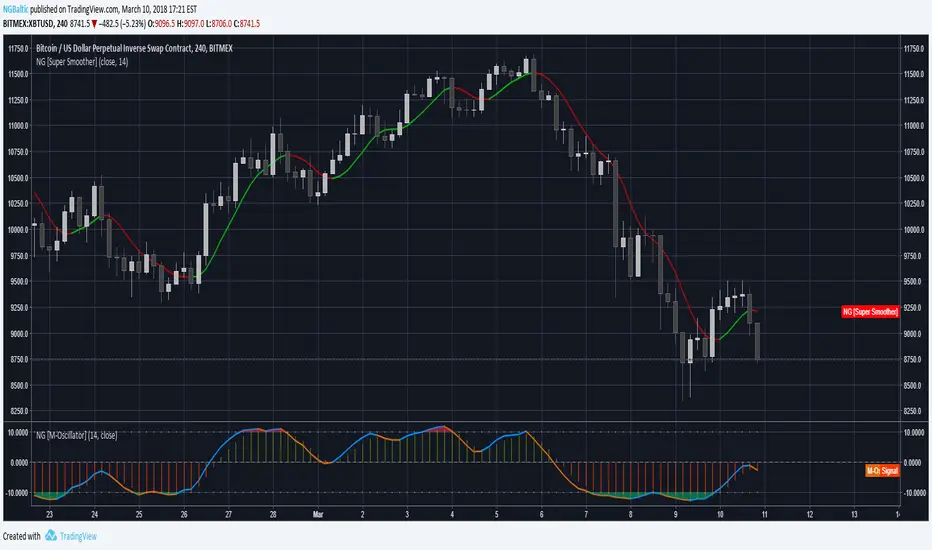
The M-Oscillator is a bounded oscillator that moves between (-14) and (+14), it gives early buy/sell signals, spots divergences, displays overbought/oversold levels, and provides re-entry points, and it also work as a trend identifier.
Interpretation
• M-Oscillator is plotted along the bottom of the price chart; it fluctuates between positive and negative 14.
• Movement above 10 is considered overbought, and movement below -10 is oversold.
• In sharp moves to the upside, the M-Oscillator fluctuates between 5 and 14, while in down side it fluctuates between -5 and -14.
• In an uptrend, the M-Oscillator fluctuates between zero and 14 and vice versa.
Trading tactics
Overbought/Oversold: We define the overbought area as anywhere above the 10 level.
The oversold area is below -10. When the M-Oscillator goes above 10 (overbought) and then re-crosses it to the downside, a sell signal is triggered.
When the M-Oscillator surpasses -10 to the downside and then re-crosses back above this level, a buy signal is triggered.
This tactic is only successful during sideways markets; during an uptrend, the oscillator will remain in its overbought territory for long period of times.
During a downtrend, it will remain in oversold for a long time.
Divergence
Divergence is one of the most striking features of the M-Oscillator.
It is a very important aspect of technical analysis that enhances trading tactics enormously; it shows hidden weakness or strength in the market, which is not apparent in the price action.
A positive divergence occurs when the price is declining and makes a lower low, while M-Oscillator witnesses a higher low.
A negative divergence occurs when the price is rising and makes a higher High, while the M-Oscillator makes a lower high, which indicates hidden weakness in the market.
Divergences are very important as they give us early hints of trend reversal (weekly chart)
Script open-source
Dans l'esprit TradingView, le créateur de ce script l'a rendu open source afin que les traders puissent examiner et vérifier ses fonctionnalités. Bravo à l'auteur! Bien que vous puissiez l'utiliser gratuitement, n'oubliez pas que la republication du code est soumise à nos Règles.
Clause de non-responsabilité
Les informations et publications ne sont pas destinées à être, et ne constituent pas, des conseils ou recommandations financiers, d'investissement, de trading ou autres fournis ou approuvés par TradingView. Pour en savoir plus, consultez les Conditions d'utilisation.