INVITE-ONLY SCRIPT
The Manager
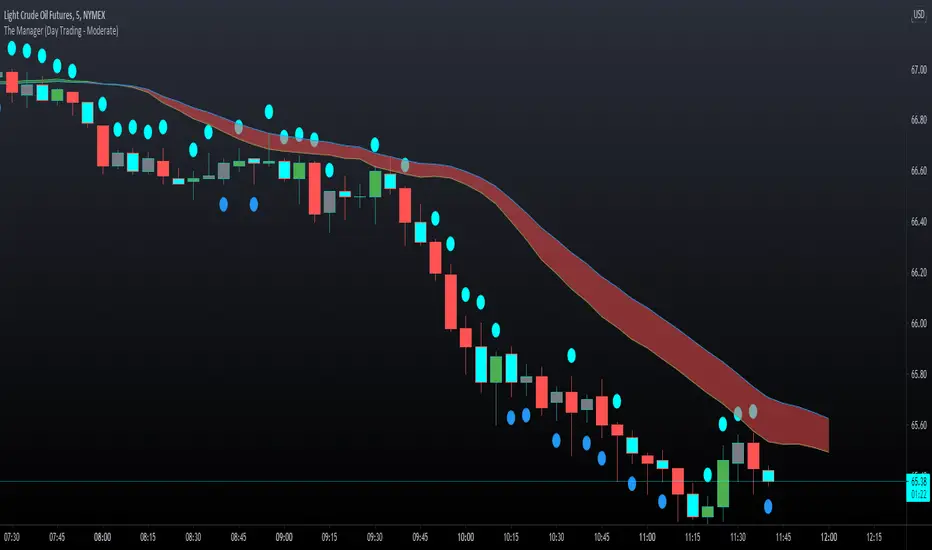
The Manger is a simple and repeatable trade management indicator suite for all instruments and for all timeframes.
The strategy that makes up this trade management tool includes:
1. Average volume calculations with auto lookbacks - Each candle then is identified as being above or below average volume with Dots above or below each candle.
2. Volume Distribution or Accumulation candles - Identifies if the candle has higher or lower volume compared to previous candle
a. If Higher volume and is a Down candle it is a distribution candle and is coloured Red.
b. If Higher volume and is an Up candles it is an accumulation candle and is coloured Green.
3. Adjustable BIAS cloud with four settings for Day Trading and Swing Trading. Red is Bearish BIAS with Price action and Green is a Bullish BIAS with Price Action.
Some of the simple rules to follow when using "The Manager" to help manage your trades Long or Short. (More is covered in our tutorial video)
1. When Short Trading and you get a Green Accumulation Candle with a Cyan Dot Above candle (Higher than Average Volume) printed. This is a sign of a potential reversal against your short trade and an aggressive profit taking exit is necessary.
2. When Long Trading and you get a Red Distribution Candle with a Cyan Dot Above candle (Higher than Average Volume) printed. This is a sign of a potential reversal against your long trade and an aggressive profit taking exit is necessary.
3. Pullbacks against the direction of your trade with Blue Dots Below Candles (Lower than average volume) show low momentum pullbacks and a sign to stay in your trade or revert to BIAS Cloud rules.
4. BIAS Cloud - When Green Changes to Red, this is your conservative exit for Long Trades. - When Red changes to Green, this is your conservative exit for short trade.
5. BIAS Cloud - When day trading and your position has a parabolic move - change settings to day trading aggressive
6. BIAS Cloud - When Swing trading and your position has a parabolic move - change settings to day trading conservative or moderate depending on how much room you want to give for a pullback against the direction of your swing trade.
Remember when day trading or swing trading, there is usually a data or news catalyst that reverses the direction of an instrument and potentially a trade that you are in. "The Manager" soon spots those with either accumulation or distribution candles combining with higher than average volume. And usually with a distinct candle stick formation rejecting highs or lows. The ability for you to visually see this on your chart with our indicator gives you chance to maximise your profits by understanding the behaviour represented by the coloured candles and the dots above or below the candles. The BIAS cloud allows for a more conservative approach to this as discussed above
Script sur invitation seulement
L'accès à ce script est limité aux utilisateurs autorisés par l'auteur et nécessite généralement un paiement. Vous pouvez l'ajouter à vos favoris, mais vous ne pourrez l'utiliser qu'après avoir demandé et obtenu l'autorisation de son auteur. Contactez PBratbyOfficial pour plus d'informations, ou suivez les instructions de l'auteur ci-dessous.
TradingView ne suggère pas de payer pour un script et de l'utiliser à moins que vous ne fassiez confiance à 100% à son auteur et que vous compreniez comment le script fonctionne. Dans de nombreux cas, vous pouvez trouver une bonne alternative open-source gratuite dans nos Scripts communautaires.
Instructions de l'auteur
″Watch videos and learn more about this indicator on our website here https://globaltradingsoftware.com/product/the-manager-for-tradingview/
Vous voulez utiliser ce script sur un graphique ?
Avertissement: veuillez lire avant de demander l'accès.
Learn More about my Signature XBrat Algo Trading Software for TradingView HERE globaltradingsoftware.com
Clause de non-responsabilité
Les informations et les publications ne sont pas destinées à être, et ne constituent pas, des conseils ou des recommandations en matière de finance, d'investissement, de trading ou d'autres types de conseils fournis ou approuvés par TradingView. Pour en savoir plus, consultez les Conditions d'utilisation.