OPEN-SOURCE SCRIPT
Mis à jour Original Keltner with Support And Resistance

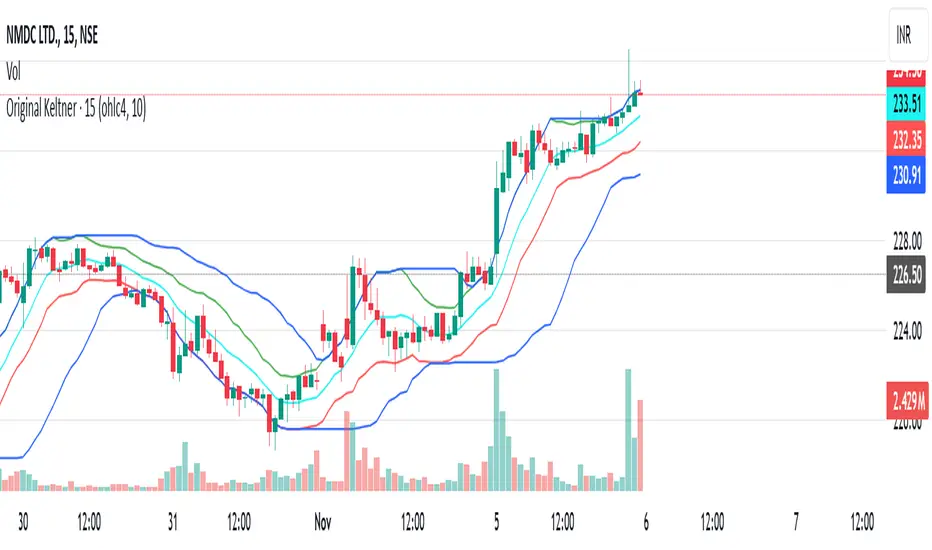
This indicator is based on the original Keltner Channels using typical price and calculating the 10 period average of high - low
Typical price = (high + low + close)/3
In this case, I've taken Typical price as (open + high + low + close)/4 on the advice of John Bollinger from his book Bollinger on Bollinger Bands.
Buy Line = 10 Period Typical Price Average + 10 Period Average of (High - Low)
Sell Line = 10 Period Typical Price Average - 10 Period Average of (High - Low)
This is the basis for the indicator. I've added the highest of the Buy Line and lowest of the Sell Line for the same period which acts as Support and Resistance.
If price is trending below the Lowest of Sell Line, take only sell trades and the Lowest Line acts as resistance.
If price is trending above the Highest of Buy Line, take only buy trades and the Highest Line acts as support.
Notes de version
Removed the bool argument since it doesn't get with the indicator's purpose.Script open-source
Dans l'esprit TradingView, le créateur de ce script l'a rendu open source afin que les traders puissent examiner et vérifier ses fonctionnalités. Bravo à l'auteur! Bien que vous puissiez l'utiliser gratuitement, n'oubliez pas que la republication du code est soumise à nos Règles.
Clause de non-responsabilité
Les informations et publications ne sont pas destinées à être, et ne constituent pas, des conseils ou recommandations financiers, d'investissement, de trading ou autres fournis ou approuvés par TradingView. Pour en savoir plus, consultez les Conditions d'utilisation.
Script open-source
Dans l'esprit TradingView, le créateur de ce script l'a rendu open source afin que les traders puissent examiner et vérifier ses fonctionnalités. Bravo à l'auteur! Bien que vous puissiez l'utiliser gratuitement, n'oubliez pas que la republication du code est soumise à nos Règles.
Clause de non-responsabilité
Les informations et publications ne sont pas destinées à être, et ne constituent pas, des conseils ou recommandations financiers, d'investissement, de trading ou autres fournis ou approuvés par TradingView. Pour en savoir plus, consultez les Conditions d'utilisation.