OPEN-SOURCE SCRIPT
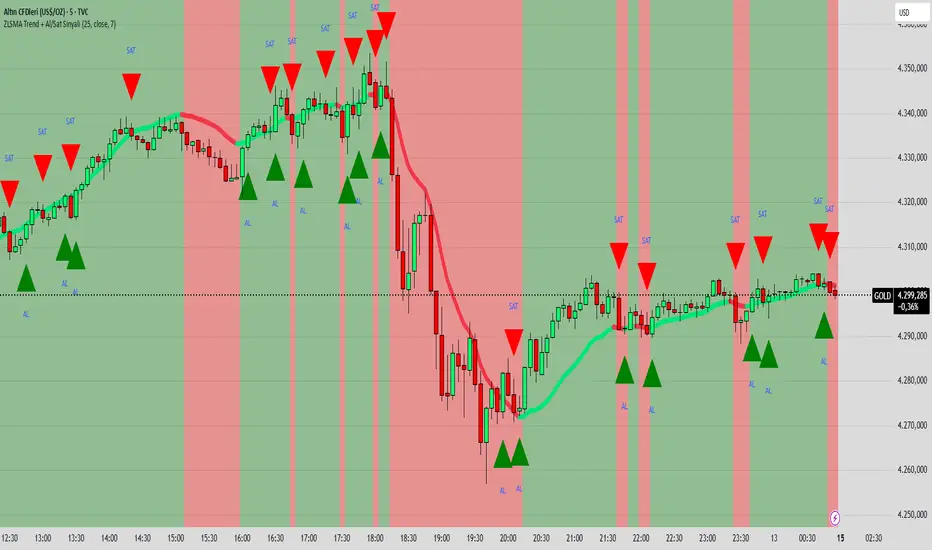
ZLSMA Trend + Al/Sat Sinyali
/version=6
indicator("ZLSMA Trend + Al/Sat Sinyali", overlay=true, max_labels_count=500)
length = input.int(25, "ZLSMA Periyodu")
src = input.source(close, "Kaynak")
thickness = input.int(4, "Çizgi Kalınlığı")
colorUp = input.color(color.new(color.lime, 0), "Yükselen Renk")
colorDown = input.color(color.new(color.red, 0), "Düşen Renk")
ema1 = ta.ema(src, length)
ema2 = ta.ema(ema1, length)
zlsma = 2 * ema1 - ema2
trendUp = zlsma > zlsma[1]
trendDown = zlsma < zlsma[1]
zlsmaColor = trendUp ? colorUp : colorDown
plot(zlsma, title="ZLSMA", color=zlsmaColor, linewidth=thickness)
buySignal = ta.crossover(close, zlsma)
sellSignal = ta.crossunder(close, zlsma)
plotshape(buySignal, title="Al", location=location.belowbar, color=color.new(color.lime, 0), style=shape.triangleup, size=size.large, text="AL")
plotshape(sellSignal, title="Sat", location=location.abovebar, color=color.new(color.red, 0), style=shape.triangledown, size=size.large, text="SAT")
bgcolor(trendUp ? color.new(color.lime, 90) : color.new(color.red, 90))
Script open-source
Dans l'esprit TradingView, le créateur de ce script l'a rendu open source afin que les traders puissent examiner et vérifier ses fonctionnalités. Bravo à l'auteur! Bien que vous puissiez l'utiliser gratuitement, n'oubliez pas que la republication du code est soumise à nos Règles.
Clause de non-responsabilité
Les informations et publications ne sont pas destinées à être, et ne constituent pas, des conseils ou recommandations financiers, d'investissement, de trading ou autres fournis ou approuvés par TradingView. Pour en savoir plus, consultez les Conditions d'utilisation.