PROTECTED SOURCE SCRIPT
Mis à jour DOM + T&S by TradeEarn
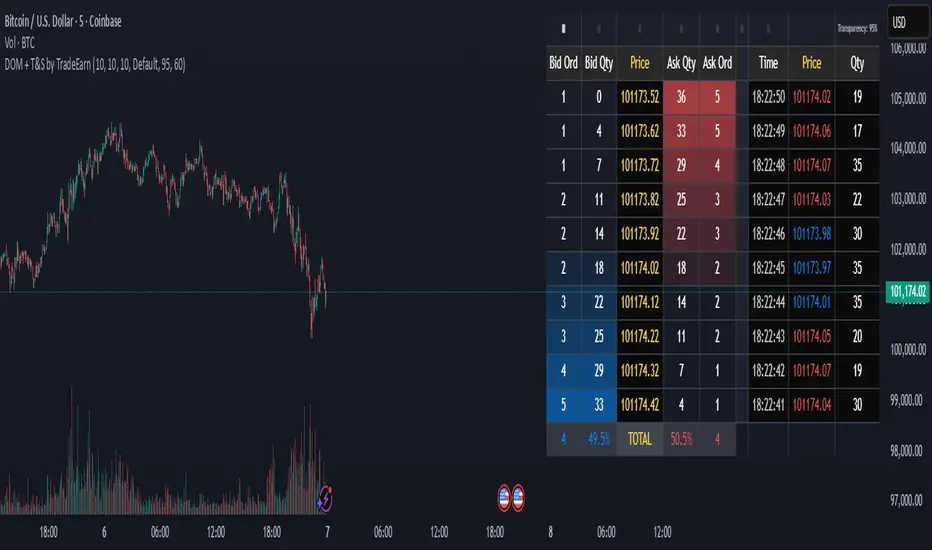
This code is for an indicator that displays a pseudo-Depth of Market (DOM) and Time & Sales (T&S) table directly on the chart. Because Pine Script does not have direct access to real-time order book data, this indicator reconstructs a representation of order flow dynamics using available chart data (volume and price), providing a visual approximation for analytical purposes.
DOM + T&S by TradeEarn
This powerful indicator provides traders with a real-time, side-panel view of market dynamics, combining the visual feedback of a Depth of Market (DOM) with a simulated Time & Sales (T&S) tape. Get a clearer picture of order flow and market pressure directly on your chart, helping you to identify potential support, resistance, and liquidity zones.
Key Features
Pseudo-DOM Table: Visualizes market depth by showing a ladder of simulated buy and sell orders at various price levels around the current price. It provides a heatmap effect to intuitively gauge areas of higher potential liquidity.
Simulated Time & Sales (T&S): Displays a streaming list of recent "trades" (based on chart volume and price action), including the time, price, and quantity. This helps visualize the pace and intensity of market execution.
Customizable Layout: Choose between "Default," "Compact," and "Wide" presets to optimize the table's appearance for your specific screen and trading preferences. You can also customize the font size.
Heatmap Visualization: Optionally enable a heatmap on the DOM table, where the intensity of the color dynamically reflects the volume at each price level, providing a quick visual cue for areas of high interest.
Total Volume Summary: An optional totals row at the bottom of the DOM table provides a quick percentage breakdown of total simulated bid versus ask volume, giving you an at-a-glance market sentiment reading.
How to Use
Observe Liquidity: Monitor the DOM table to see where potential areas of buy (bid) and sell (ask) pressure are building. Large volumes (indicated by more intense colors with the heatmap) may suggest strong support or resistance.
Track Order Flow: Use the Time & Sales to see recent executed trades. A high frequency of trades at a certain price can indicate strong market participation at that level.
Identify Imbalances: Look for disparities in the total bid vs. ask volume. A significant imbalance could indicate a potential shift in market sentiment.
Confirm Breakouts: Use the DOM as a supporting tool to confirm the strength of breakouts. A breakout on the price chart that coincides with a push through a large liquidity zone on the DOM could be a more reliable signal.
Note: This indicator uses chart data to reconstruct the DOM and T&S view. It is not connected to a live order book and should be used for analytical purposes alongside other trading tools.
Notes de version
This code is for an indicator that displays a pseudo-Depth of Market (DOM) and Time & Sales (T&S) table directly on the chart. Because Pine Script does not have direct access to real-time order book data, this indicator reconstructs a representation of order flow dynamics using available chart data (volume and price), providing a visual approximation for analytical purposes.DOM + T&S by TradeEarn
This powerful indicator provides traders with a real-time, side-panel view of market dynamics, combining the visual feedback of a Depth of Market (DOM) with a simulated Time & Sales (T&S) tape. Get a clearer picture of order flow and market pressure directly on your chart, helping you to identify potential support, resistance, and liquidity zones.
Key Features
Pseudo-DOM Table: Visualizes market depth by showing a ladder of simulated buy and sell orders at various price levels around the current price. It provides a heatmap effect to intuitively gauge areas of higher potential liquidity.
Simulated Time & Sales (T&S): Displays a streaming list of recent "trades" (based on chart volume and price action), including the time, price, and quantity. This helps visualize the pace and intensity of market execution.
Customizable Layout: Choose between "Default," "Compact," and "Wide" presets to optimize the table's appearance for your specific screen and trading preferences. You can also customize the font size.
Heatmap Visualization: Optionally enable a heatmap on the DOM table, where the intensity of the color dynamically reflects the volume at each price level, providing a quick visual cue for areas of high interest.
Total Volume Summary: An optional totals row at the bottom of the DOM table provides a quick percentage breakdown of total simulated bid versus ask volume, giving you an at-a-glance market sentiment reading.
How to Use
Observe Liquidity: Monitor the DOM table to see where potential areas of buy (bid) and sell (ask) pressure are building. Large volumes (indicated by more intense colors with the heatmap) may suggest strong support or resistance.
Track Order Flow: Use the Time & Sales to see recent executed trades. A high frequency of trades at a certain price can indicate strong market participation at that level.
Identify Imbalances: Look for disparities in the total bid vs. ask volume. A significant imbalance could indicate a potential shift in market sentiment.
Confirm Breakouts: Use the DOM as a supporting tool to confirm the strength of breakouts. A breakout on the price chart that coincides with a push through a large liquidity zone on the DOM could be a more reliable signal.
Note: This indicator uses chart data to reconstruct the DOM and T&S view. It is not connected to a live order book and should be used for analytical purposes alongside other trading tools.
Protected script
This script is published as closed-source. However, you can use it freely and without any limitations – learn more here.
MANJUCSW5
MANJU
Disclaimer
The information and publications are not meant to be, and do not constitute, financial, investment, trading, or other types of advice or recommendations supplied or endorsed by
Script protégé
Ce script est publié en source fermée. Toutefois, vous pouvez l'utiliser librement et sans aucune restriction - en savoir plus ici.
MANJU
Clause de non-responsabilité
Les informations et les publications ne sont pas destinées à être, et ne constituent pas, des conseils ou des recommandations en matière de finance, d'investissement, de trading ou d'autres types de conseils fournis ou approuvés par TradingView. Pour en savoir plus, consultez les Conditions d'utilisation.