ES Bundle
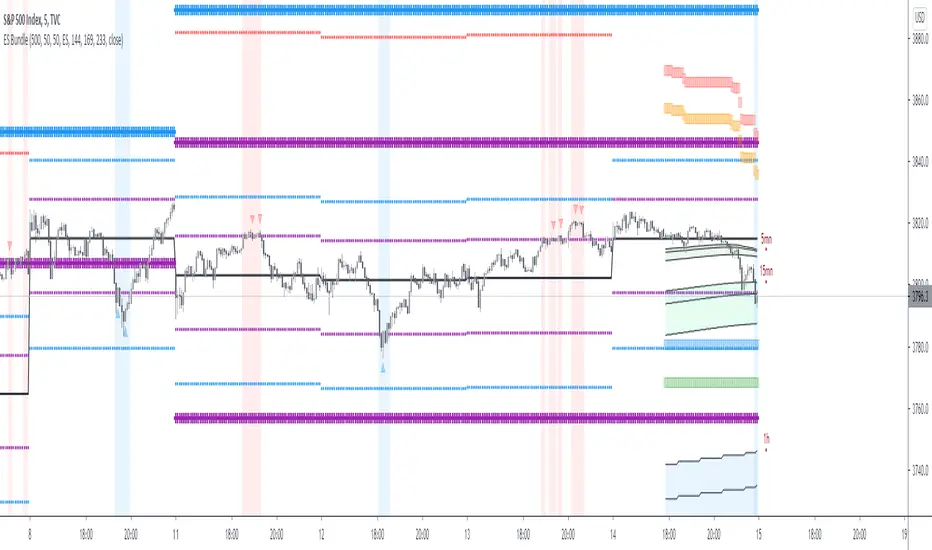
It is a simulation of marker behavior resulting in 2 kind of level:
Oversold and overbougth level:
* It is square shape: orange and red are 1st and 2nd level of Overbougth ( high probability to down of 16 points if you have a bearish divergence of momemtum above these levels)
* It is square shape:blue and green are 1st and 2nd level of Overbougth ( high probability to upof 16 points if you have a bullish divergence of momemtum above these levels)
*In case of crazy market rend (10% of the time, only small reversal is expected but more often than not momemtum will not plot divergence)
Level of support and resistance
*There is 2 size ( cross shaped pattern), the small is for daily timeframe and the large is for weekly timeframe
*Purple line is the fiest and weakest area of resistance or support
*Blue cross is and interesting level, if momemtum plot divergence above blue resistance or below bull support it is time to search for short or long respectivly
*Red line is when crazy market happen, every divergence above or below red line is a major trade reversal
Obviously if you are on support level + under oversold zone it is the best setup to long and vice versa
*Adding Bundle for GC, CL, SPX, BTC and VIX
* Adding FIlter for signal ( red and blue triangle)
*All signal must be filtered by divergence on momemtum reader (see indicator on tradingview)
Script sur invitation seulement
Seuls les utilisateurs approuvés par l'auteur peuvent accéder à ce script. Vous devrez demander et obtenir l'autorisation pour l'utiliser. Celle-ci est généralement accordée après paiement. Pour plus de détails, suivez les instructions de l'auteur ci-dessous ou contactez directement nonobdx.
TradingView ne recommande PAS d'acheter ou d'utiliser un script à moins que vous ne fassiez entièrement confiance à son auteur et que vous compreniez son fonctionnement. Vous pouvez également trouver des alternatives gratuites et open source dans nos scripts communautaires.
Instructions de l'auteur
discord.gg/b7YGtY2
Site internet: marketreader.fr/
Chaine Youtube : youtube.com/channel/UC-a7p8DkfbDM6ONrTzsaErA?view_as=subscriber
Clause de non-responsabilité
Script sur invitation seulement
Seuls les utilisateurs approuvés par l'auteur peuvent accéder à ce script. Vous devrez demander et obtenir l'autorisation pour l'utiliser. Celle-ci est généralement accordée après paiement. Pour plus de détails, suivez les instructions de l'auteur ci-dessous ou contactez directement nonobdx.
TradingView ne recommande PAS d'acheter ou d'utiliser un script à moins que vous ne fassiez entièrement confiance à son auteur et que vous compreniez son fonctionnement. Vous pouvez également trouver des alternatives gratuites et open source dans nos scripts communautaires.
Instructions de l'auteur
discord.gg/b7YGtY2
Site internet: marketreader.fr/
Chaine Youtube : youtube.com/channel/UC-a7p8DkfbDM6ONrTzsaErA?view_as=subscriber