PROTECTED SOURCE SCRIPT
Major S&R Levels with Flips
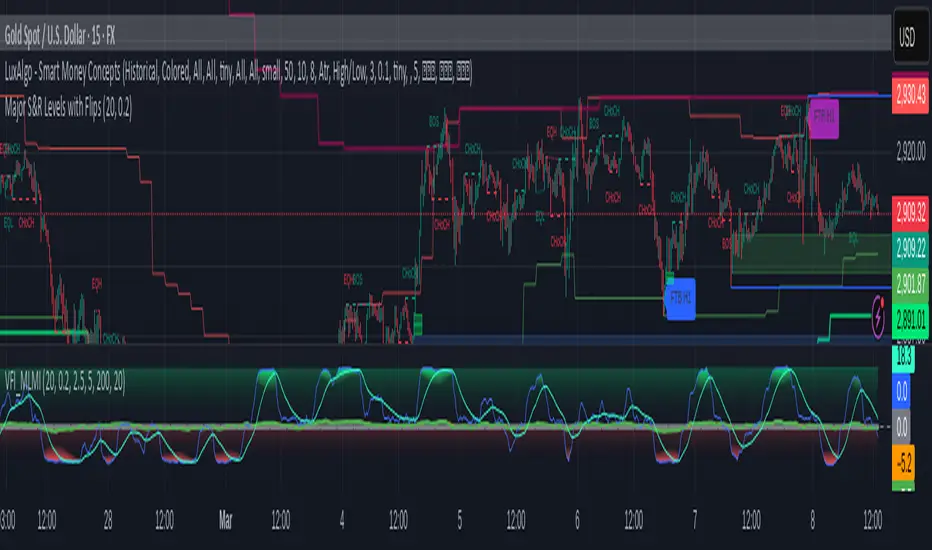
## **Major S&R Levels with Flips**
This script is designed to identify and visualize **Major Support and Resistance (S&R) Levels** across multiple timeframes (H1, H4, D1) and detect **S&R Flip** patterns (FTB, STB, FTR). It also includes customizable alerts for price-level crossings, flip patterns, and level approaches. Below is a detailed breakdown of the script's functionality, inputs, and outputs.
---
## **Script Overview**
The script calculates and plots **Support and Resistance (S&R) Levels** based on the highest highs and lowest lows over a user-defined lookback period. It also detects **S&R Flip Patterns** (First Time Back - FTB, Second Time Back - STB, Failed Test of Resistance/Support - FTR) and provides alerts for key events.
---
## **Key Features**
1. **Multi-Timeframe S&R Levels**:
- Displays S&R levels for **H1**, **H4**, and **D1** timeframes.
- Levels are calculated using the highest highs and lowest lows over a user-defined lookback period.
2. **S&R Flip Detection**:
- Detects and tracks **FTB (First Time Back)**, **STB (Second Time Back)**, and **FTR (Failed Test of Resistance/Support)** patterns.
- Alerts are generated for each flip event.
3. **Customizable Alerts**:
- **Price-Level Crossing Alerts**: Notifies when the price crosses above or below a level.
- **Flip Alerts**: Notifies when a flip pattern (FTB, STB, FTR) is detected.
- **Level Approach Alerts**: Notifies when the price approaches a level within a user-defined threshold.
4. **Efficient Level Updates**:
- Levels are updated periodically (every 10 bars by default) to optimize performance.
5. **Visualization**:
- Plots S&R levels on the chart with distinct colors for each timeframe.
- Displays labels for recent flip events.
---
## **User Inputs**
The script provides several customizable inputs:
### **Level Display**
- **Show H1 Levels**: Toggles visibility of H1 S&R levels.
- **Show H4 Levels**: Toggles visibility of H4 S&R levels.
- **Show D1 Levels**: Toggles visibility of D1 S&R levels.
- **Lookback Period**: Defines the number of bars used to calculate S&R levels (default: 20, range: 5–50).
### **Alerts**
- **Enable Price-Level Crossing Alerts**: Toggles alerts for price crossing above/below S&R levels.
- **Enable SR Flip Alerts**: Toggles alerts for S&R flip patterns (FTB, STB, FTR).
- **Enable Level Approach Alerts**: Toggles alerts for price approaching S&R levels.
- **Approach Threshold**: Defines the percentage threshold for level approach alerts (default: 0.2%, range: 0.05%–1%).
---
## **Script Logic**
### **1. Level Calculation**
- The script calculates S&R levels for each timeframe (H1, H4, D1) using the highest highs and lowest lows over the lookback period.
- Levels are updated periodically (every 10 bars by default) to optimize performance.
### **2. Flip Detection**
- The script detects **FTB**, **STB**, and **FTR** patterns:
- **FTB (First Time Back)**: Price crosses a level for the first time.
- **STB (Second Time Back)**: Price retests the level after FTB.
- **FTR (Failed Test of Resistance/Support)**: Price fails to break the level after STB.
- Flip events are tracked and stored in arrays for visualization and alerts.
### **3. Alerts**
- **Price-Level Crossing Alerts**: Triggered when the price crosses above/below a level.
- **Flip Alerts**: Triggered when a flip pattern (FTB, STB, FTR) is detected.
- **Level Approach Alerts**: Triggered when the price approaches a level within the defined threshold.
### **4. Visualization**
- S&R levels are plotted on the chart with distinct colors for each timeframe.
- Labels are displayed for recent flip events (up to 15 labels by default).
---
## **Outputs**
### **1. Plots**
- **H1 Levels**:
- Support: Green shaded area.
- Resistance: Red shaded area.
- **H4 Levels**:
- Support: Lime shaded area.
- Resistance: Maroon shaded area.
- **D1 Levels**:
- Support: Teal shaded area.
- Resistance: Purple shaded area.
### **2. Labels**
- Labels are displayed for recent flip events:
- **FTB**: Blue label.
- **STB**: Yellow label.
- **FTR**: Purple label.
### **3. Alerts**
- Alerts are generated for:
- Price-level crossings.
- Flip patterns (FTB, STB, FTR).
- Price approaching levels.
---
## **Usage Instructions**
1. **Add the Script**:
- Copy and paste the script into a new Pine Script editor in TradingView.
- Save and add the script to your chart.
2. **Customize Inputs**:
- Adjust the inputs (e.g., lookback period, alert settings) in the script settings panel.
3. **Interpret the Output**:
- Use the plotted levels and labels to identify key S&R zones and flip patterns.
- Monitor alerts for trading opportunities.
4. **Optimize for Your Strategy**:
- Adjust the lookback period and alert thresholds to suit your trading style.
---
## **Example Use Cases**
1. **Trend Identification**:
- Use the D1 levels to identify major S&R zones for long-term trend analysis.
- Combine with H4 and H1 levels for intraday trading opportunities.
2. **Flip Patterns**:
- Look for FTB and STB patterns to identify potential reversals.
- Use FTR patterns to confirm failed breakouts.
3. **Alerts for Trading**:
- Set up alerts for price-level crossings and flip patterns to stay informed of key market movements.
---
## **Notes**
- The script is optimized for performance by updating levels periodically and limiting the number of tracked flips.
- Alerts are designed to minimize noise by triggering only once per bar or bar close.
---
## **Disclaimer**
This script is for educational and informational purposes only. It should not be considered financial advice. Always conduct your own analysis and backtesting before using any trading strategy.
---
This documentation provides a comprehensive guide to using the **Major S&R Levels with Flips** script. If you have any questions or need further assistance, feel free to reach out!
Script protégé
Ce script est publié en source fermée. Cependant, vous pouvez l'utiliser librement et sans aucune restriction – pour en savoir plus, cliquez ici.
Clause de non-responsabilité
Les informations et publications ne sont pas destinées à être, et ne constituent pas, des conseils ou recommandations financiers, d'investissement, de trading ou autres fournis ou approuvés par TradingView. Pour en savoir plus, consultez les Conditions d'utilisation.