OPEN-SOURCE SCRIPT
SMA 50–200 Fill (Bull/Bear Colors)

Overview
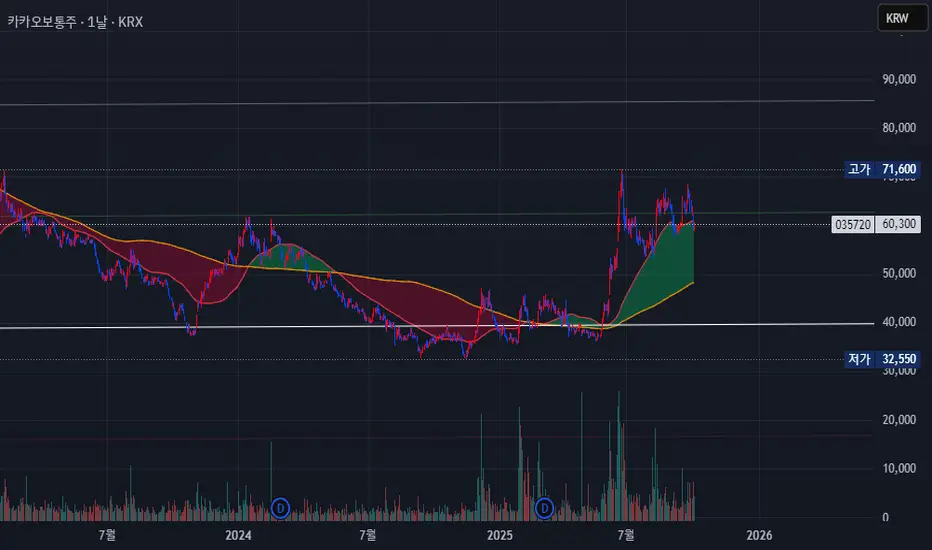
This TradingView Pine Script plots two simple moving averages (SMAs): one with a period of 50 and one with a period of 200. It also fills the area between the two SMAs. The fill color automatically changes depending on whether the 50-period SMA is above or below the 200-period SMA:
Bullish scenario (50 > 200): uses one color (bullFillColor)
Bearish scenario (50 < 200): uses another color (bearFillColor)
You can also customize the transparency of the filled area and the colors/widths of the SMA lines.
Key Parts of the Code
Inputs
src: The price source (default: close).
fastColor and slowColor: Colors for the 50- and 200-SMA lines.
bullFillColor and bearFillColor: The two fill colors used depending on whether the 50 SMA is above or below the 200 SMA.
fillTrans: The transparency of the fill (0 = fully opaque, 100 = fully transparent).
lwFast and lwSlow: Line widths of the 50- and 200-SMA lines.
Calculations
sma50 = ta.sma(src, 50)
sma200 = ta.sma(src, 200)
These two lines compute the moving averages of the chosen source price.
Plotting the SMAs
p50 and p200 use plot() to draw the SMA lines on the chart.
Each plot uses the chosen color and line width.
Dynamic Fill Color
A conditional determines which color to use:
fillColor = sma50 > sma200 ? color.new(bullFillColor, fillTrans) : color.new(bearFillColor, fillTrans)
If the 50 SMA is greater than the 200 SMA, the bullish color is used; otherwise, the bearish color is used.
Filling the Area
fill(p50, p200, color=fillColor) creates a shaded area between the two SMAs.
Because fillColor changes depending on the condition, the filled area automatically changes color when the SMAs cross.
How to Use It
Add to Chart: When you add this script to your chart, you’ll see the 50 and 200 SMAs with a shaded area between them.
Customize Colors: You can change line colors, fill colors, and transparency directly from the indicator’s settings panel.
Visual Cues: The fill color gives you an instant visual cue whether the short-term trend (50 SMA) is above or below the long-term trend (200 SMA).
Benefits
Gives a clear, simple visual representation of the trend’s strength and direction.
The customizable transparency lets you make the shading subtle or bold depending on your chart style.
Works on any time frame or instrument where you’d like to compare a short-term and long-term moving average.
Script open-source
Dans l'esprit de TradingView, le créateur de ce script l'a rendu open-source, afin que les traders puissent examiner et vérifier sa fonctionnalité. Bravo à l'auteur! Vous pouvez l'utiliser gratuitement, mais n'oubliez pas que la republication du code est soumise à nos Règles.
Clause de non-responsabilité
Les informations et les publications ne sont pas destinées à être, et ne constituent pas, des conseils ou des recommandations en matière de finance, d'investissement, de trading ou d'autres types de conseils fournis ou approuvés par TradingView. Pour en savoir plus, consultez les Conditions d'utilisation.