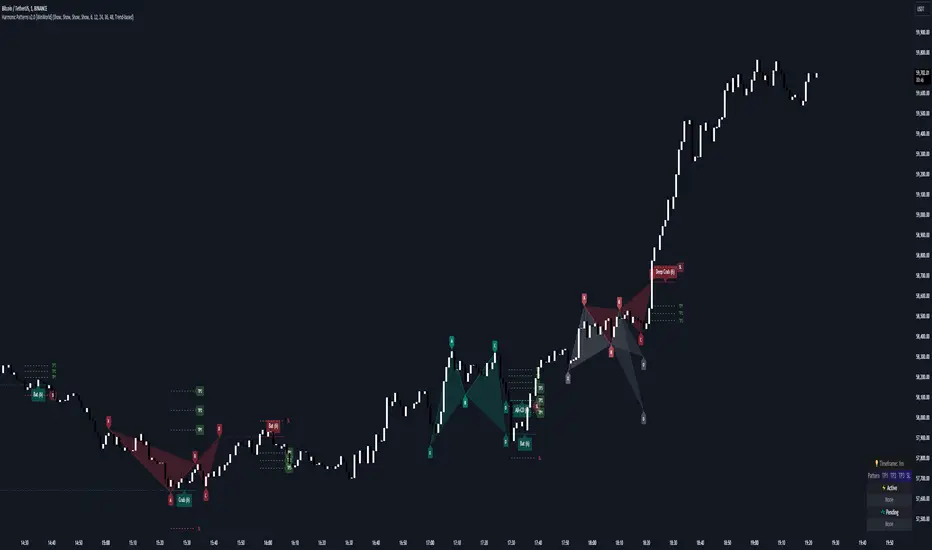
Harmonic Patterns [WinWorld]
This indicator was made with the help of our team's fellow friend and harmonic patterns expert, whose support we deeply appreciate — Muneer_Gove
DESCRIPTION
Harmonic patterns are one the most recognizable and popular trading concepts in the word of trading.
They are distinct formations, found in the financial markets, that predict potential price movements based on Fibonacci ratios. These patterns, which include the Gartley, Bat, Alt Bat, Butterfly and etc., identify specific and repetitive price structures that can forecast future price reversals. By incorporating these patterns into trading process, one does gain an opportunity to profit from repetetitve price movements.
The whole thing about harmonic pattern is the process of finding them. The basic step-by-step guide to build a harmonic pattern is this:
- Locate significant highs and lows on the chart, which form the basis of the pattern. The best tools to use for this purple is zigzag, because zigzag indicator draw lines, which will be helpful quite helpful in the process and will save you a lot of time;
- Use Fibonacci tools to measure the retracement and extension levels between legs of pattern — distances between pair of points. Each harmonic pattern has specific Fibonacci ratios that define its structure;
- Draw lines connecting the pivot points according to the pattern's structure. For example, a Gartley pattern connects five points (X, A, B, C, D) in a specific sequence and ratio;
- Ensure that the identified structure adheres to the harmonic pattern’s Fibonacci requirements. If the points align within the acceptable ranges, the pattern is valid.
In order to better understand this process let's see an example of the pattern from our indicator right away:
This is a Butterfly pattern. Its set of retracememt ratios is as follows:
- AB/XA = 0.756 to 0.816
- BC/AB = 0.382 to 0.990
- CD/BC = 1.618 to 2.618
- AD/XA = 1.27
Below you can see that each ratio of the pattern is successfully met:
* Note: white lines — ratio range, yellow line — point 's price level in between ranges.
AB/XA Ratio
BC/AB Ratio
CD/BC Ratio
AD/XA Ratio
SETTINGS
Main Settings
- Failed Patterns — shows/hides patterns, which meet one of these conditions:
— Price crossed level of point C before reaching PRZ;
— New pattern appeared and PRZ of previous pattern was not reached; - Completed Patterns — shosw/hides patterns, whose PRZ was reached;
- Dashboard — shows/hides dashboard, which displays active patterns (patterns, which can be used to trade).
Alert Settings
- PRZ — enables/disables alert of event, when price reaches PRZ.
ZigZag Settings
- Depth #1-9 — shows/hides patterns of the chosen zigzag copy. Here you can choose customize depth number.
Pattern Visual Controls
- Bullish Patterns — shows/hides bullish patterns;
- Bearish Patterns — shows/hides bearish patterns;
- Pending Patterns — shows/hides patterns, whose PRZ has not been reached yet;
- list of pattern names — hides/shows chosen pattern.
Colours
- Bullish — colour of bullish patterns;
- Bearish — colour of bearish patterns.
IMPORTANT CONCEPTS
PRZ — entry target level.
If its text near the line level is purple, it means that PRZ has NOT been reached yet.
If it is white, it means that PRZ has been reached.
In order for SL or TP to be counted when price reaches, price has to reach PRZ first with its high/low.
SL — stop-loss.
If its near the line level is red, it means that SL has NOT been reached yet.
If it is white, it means that SL has been reached.
If it is gray, it means that SL has been invalidated — price crossed with high/low the level of point C before reaching PRZ.
If SL is reached and price reaches TP targets, they will be counted.
SL of each pattern are built by individual ratio. For example, in Butterfly pattern SL ratio is 1.414 and it is calculated as (SL - A)/XA.
IMPORTANT NOTE: SL is reached when price crosses SL level with candle's close (!)
TP — take-profit.
If its near the line level is green, it means that TP has NOT been reached yet.
If it is white, it means that TP has been reached.
If one of the TP targets is reached and price reached SL, it will not be counted.
IMPORTANT NOTE: TP is reached when price crosses TP level with candle's high/low(!)
TP of each pattern are built by same the ratios for all patterns, but it is calculated by individual algorithm. For example, in the same Butterfly pattern TP ratio will be 0.382, 0.500 and 0.618 and they will be placed as Fibonacci retracement grid from point A to point D (same for formula for all other patterns, excluding the ones listed next), BUT on Shark, Muner and AB=CD pattern the same TP will be placed as Fibonacci retracement grid from point C to point D
WHY USE THIS INDICATOR?
Our Harmic Patterns indicator uses zigzag, which is based on depth mechanic. In order to identify the maximum possible amount of patterns this indicator runs 9 copies of the same zigzags with different depth values. Each copy of zigzag can be turned off in the settings individually.
At the moment of publishing, this indicator can autmatically identify 10 patterns:
- Crab
- Deep Crab
- Gartley
- Deep Gartley
- Bat
- Alt Bat
- Muner
- Butterfly
- Shark
- AB=CD
Things, that make this indicator different from other harmonic pattern indicator, are:
- Advanced pattern recognition and validation process. We have implemeted special logic, which allows the indicator to draw fully accurate patterns, which satisfy industry standards.
For example, let's say we have a bearish pattern. We take points X an A. If there is a price's high, that is above X point's high, such pattern should be automatically invalidated. We have found even one indicator that does perform such validation process, and our indicator does that.. And this is just one example, we have much of such mechanics implemeted thanks to Mr. Muner's knowledge. - Advanced pattern extension mechanics. Right this mechanic applies to only one pattern — Shark. Its classic CD/BC ratio is 0.886, but when price moves in a way so this ratio now equals to 1.13, this signal the indicator to redraw the pattern, based on this new CD/BC ratio. We haven't found any indicator on the market that has such mechanic implemented.
- Dashboard for displaying active patterns. On this dashboard you can find patterns, whose SL and TP have not been touched yet. If price touches the SL or TP of the pattern, this pattern is removed from the dashboard, because it is considered finished.
At the moment of publishing this dashboard only shows the patterns from the current timeframe. - Informative alert when price reaches PRZ of the pattern. Many other indicator do not provide details of this event, which requires trader to waste his time on opening up the chart and searching for this event. Our indicator allows trader to see the PRZ price right when alert happens and open up the trade much fastr.
Alert message is made by this template:Pine Script® <ticker>, <trend> <pattern name>: PRZ was reached at <prz price> on <timeframe>
Example:Pine Script® BTCUSDT, long Bat: PRZ was reached at 70,000 on 15m.
ALERTS
At the moment of publishing this indicator offers one alert, which happens when price reaches PRZ level.
HOW CAN I GET THE MOST OUT OF THIS INDICATOR?
This indicator can act as the standalone tool, because PRZ, TP and SL are assigned to each pattern and tracked during the pattern's life period.
You can this indicator with any other strategy or indicator, because this indicator is basically a tool that shows the trader repetitive price formations, after which price tends to go a certaion direction in the most cases, allowing trader to profit from it.
You can try combining Harmonic Patterns indicator with Smart Money tools, made by our team, because Smart Money strategies basically show the most liquid price zones and levels, which can be used to find an entry opportunity and Harmonic Patterns indicator can be added to make a final decision on the entry.
If you are interested in trying these two strategies together, feel free to learn Smart Money trading strategy by reading our Advanced SMC guide, which is available in our eductional materials.
SUMMARY
Harmonic Patterns indicator is an advanced tool of technical analysis, which automatically finds 10 most used harmonic patterns on the chart, assign PRZ, TP and SL targets to them and tracks them during each pattern 'life period'.
While searching for these patterns, this indicator performs series of validation techniques, that allow trader to see only the most valid patterns, which have a higher changes to succeed.
This indicator can be used both as a standalone tool and as 'team player' for any stategy by being the tool, which can be used for making a final decision on an entry target.
AFTERWORD
This indicator has been developed for more than 2 weeks, which consisted of everyday discussions, bug fixes and special additons to the algorithm in order to making patterns more valid, so we really hope you will find a great use of this indicator and it will help you recude time on the analysis and boost your profits :)
We want to express our gratitude to Muneer_Gove once again, because he has done huge job helping us fine-tuning the algorithm, building complex pattern validatiom and extension logic and fixing bugs. Thank you!
Best of luck, traders!
— with love, WinWorld Team
+ Added new group of settings — Patterns | General Colour Settings.
Now user can choose to colour each either individually or based on pattern's trend: bullish or bearish. If user wants to colour each pattern one by one, he needs to set Colour for Each Pattern to Individual and choose colours for each pattern in the group of settings below.
- Whole code was rebuilt from scratch. We have designed a completely new architecture, which is hyper-optimized and made indicator at least 4 times faster then the previous version;
- Pending (proactive; price hasn't reached PRZ yet) patterns are now available;
https://www.tradingview.com/x/AgX1uF66/Example of pending pattern. - Algorithm for searching multiple patterns on the same bar was added (previously only pattern could be found on each candle);
- Dashboard was redesigned. Now you can see both pending and active (price reached PRZ) patterns in very easy & informative way.
Also current version of the indicator allows to work with MTF patterns, but this functionality is yet to be implemented in the future.
We thank Muneer_Gove for active collaboration with our development team to ensure the quality of pattern calculation logic and user experience as a whole.
As was mentioned above, our devs completely redesigned the code and made indicator super-fast and efficient, so we are eager to hear the feedback from you to see if you have the same results :)
Enjoy!
* Added linefill for patterns. Now pattern are even easier to spot.
* Minor optimizations.
- Added option to choose bullish and bearish patterns to receive as alert;
- Fixed bug with displaying many patterns on the dashboard.
- Fixed error, which caused Shark lose BD & CD lines and point D on the chart;
- Minor optimizaitons.
- Fixed a bug, which didn't allow AB=CD pattern to be hidden when unchecked in the settings.
- Minor optimizations.
- Fixed price displaying issue for Shark patterns when their SL is reached for the first time;
- Minor optimizations.
❕ Alert reset is NOT required for this update.
Script sur invitation seulement
Seuls les utilisateurs approuvés par l'auteur peuvent accéder à ce script. Vous devrez demander et obtenir l'autorisation pour l'utiliser. Celle-ci est généralement accordée après paiement. Pour plus de détails, suivez les instructions de l'auteur ci-dessous ou contactez directement WinWorldTeam.
TradingView ne recommande PAS d'acheter ou d'utiliser un script à moins que vous ne fassiez entièrement confiance à son auteur et que vous compreniez son fonctionnement. Vous pouvez également trouver des alternatives gratuites et open source dans nos scripts communautaires.
Instructions de l'auteur
Clause de non-responsabilité
Script sur invitation seulement
Seuls les utilisateurs approuvés par l'auteur peuvent accéder à ce script. Vous devrez demander et obtenir l'autorisation pour l'utiliser. Celle-ci est généralement accordée après paiement. Pour plus de détails, suivez les instructions de l'auteur ci-dessous ou contactez directement WinWorldTeam.
TradingView ne recommande PAS d'acheter ou d'utiliser un script à moins que vous ne fassiez entièrement confiance à son auteur et que vous compreniez son fonctionnement. Vous pouvez également trouver des alternatives gratuites et open source dans nos scripts communautaires.