OPEN-SOURCE SCRIPT
VWAP & Breakout Volume Confirm

How the TradingView Indicator Works (Explained Simply)
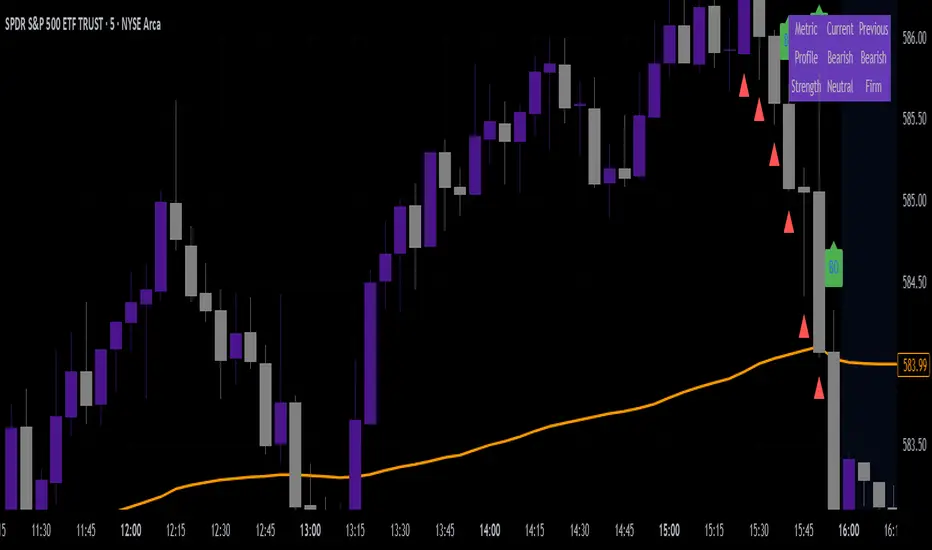
VWAP Line (Orange)
It plots the Volume Weighted Average Price for the day.
Price above VWAP = bullish zone
Price below VWAP = bearish zone
Volume Spike Detection (Red Triangle)
It calculates the average volume over the last 20 candles.
If the current volume is 1.5× that average, it plots a red triangle under the candle.
Helps confirm if a move has real momentum or not.
Breakout Confirmation (Green Label ‘BO’)
Checks if price breaks above the last 10-bar high (for upside breakout) or below the last 10-bar low (for downside breakout).
If a breakout happens and the volume spike is present, it plots a green “BO” label above the candle.
This tells you the breakout is strong and likely to follow through.
Script open-source
Dans l'esprit TradingView, le créateur de ce script l'a rendu open source afin que les traders puissent examiner et vérifier ses fonctionnalités. Bravo à l'auteur! Bien que vous puissiez l'utiliser gratuitement, n'oubliez pas que la republication du code est soumise à nos Règles.
Clause de non-responsabilité
Les informations et publications ne sont pas destinées à être, et ne constituent pas, des conseils ou recommandations financiers, d'investissement, de trading ou autres fournis ou approuvés par TradingView. Pour en savoir plus, consultez les Conditions d'utilisation.