OPEN-SOURCE SCRIPT
Mis à jour Compare (RSI) MACD
Here I've created an indicator which can be used together with my "Compare (RSI) Ticker 3x" Indicator.
It makes it much easier to see the movements between the "RSI Ticker 1" and "RSI Ticker 2/3".

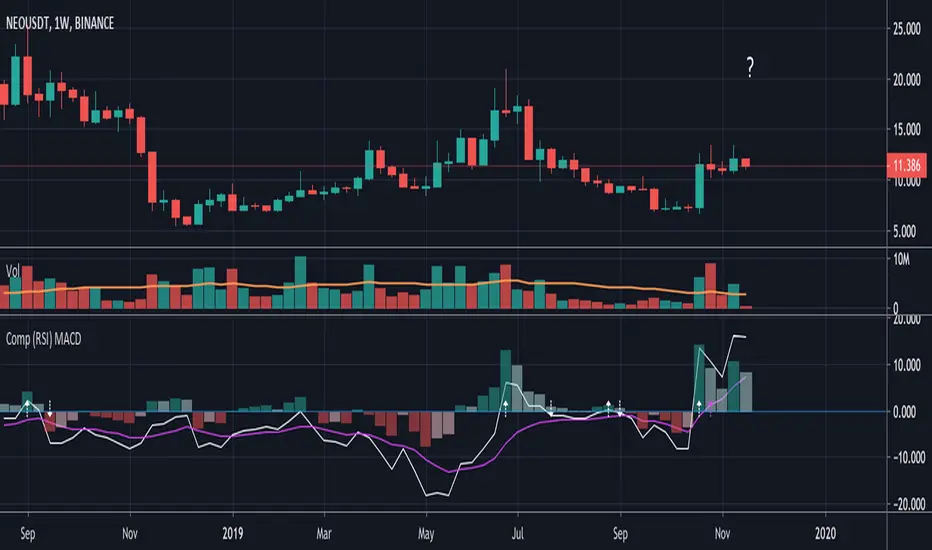
- The white line is the "MACD" of Ticker 1, which is the difference between the "RSI Ticker 1" and "RSI Ticker 2/3".
- The purple line is the "Signal" line, an EMA of the "MACD". (Length is adjustable)
- The "0-line" is the "RSI Ticker 2/3" line, when Ticker 2 is chosen, this will be blue coloured, when Ticker 3 is chosen it will be red.
Because 2 MACD in 1 indicator is way too messy, you only can choose the comparison against Ticker 2 OR Ticker 3.
- In "Settings" > "Inputs" you can enable/disable the second or third Ticker
(If Ticker 2 is enabled, Ticker 3 is disabled and vice versa)
- The second Ticker has multiple choices
- The third you can type any Ticker you want, for example CRYPTOCAP:BNB, BINANCE:ETHUSDT, NASDAQ_DLY:NDX or whatever,
just start typing and you'll see the possibilities (You also can choose between "Cryptocurrencies", "Index", "Forex", ...)
- When the "MACD" crosses the "0-line", arrows will appear, white ones for "MACD", purple ones for the "Signal" line.
- The "Histogram" makes it easier to see the difference between "MACD" and "Signal" line.
- The source of this indicator is adjustable
- When the second chosen Ticker is the same as the first Ticker, of course you will be seeing lines
(because there is no difference between the 2 Tickers, the EMA is visible though)

If you use both "Compare (RSI) Ticker 3x" AND "Compare (RSI) MACD", of course be aware that you have the same Ticker 2 or 3 in each indicator!
It makes it much easier to see the movements between the "RSI Ticker 1" and "RSI Ticker 2/3".
- The white line is the "MACD" of Ticker 1, which is the difference between the "RSI Ticker 1" and "RSI Ticker 2/3".
- The purple line is the "Signal" line, an EMA of the "MACD". (Length is adjustable)
- The "0-line" is the "RSI Ticker 2/3" line, when Ticker 2 is chosen, this will be blue coloured, when Ticker 3 is chosen it will be red.
Because 2 MACD in 1 indicator is way too messy, you only can choose the comparison against Ticker 2 OR Ticker 3.
- In "Settings" > "Inputs" you can enable/disable the second or third Ticker
(If Ticker 2 is enabled, Ticker 3 is disabled and vice versa)
- The second Ticker has multiple choices
- The third you can type any Ticker you want, for example CRYPTOCAP:BNB, BINANCE:ETHUSDT, NASDAQ_DLY:NDX or whatever,
just start typing and you'll see the possibilities (You also can choose between "Cryptocurrencies", "Index", "Forex", ...)
- When the "MACD" crosses the "0-line", arrows will appear, white ones for "MACD", purple ones for the "Signal" line.
- The "Histogram" makes it easier to see the difference between "MACD" and "Signal" line.
- The source of this indicator is adjustable
- When the second chosen Ticker is the same as the first Ticker, of course you will be seeing lines
(because there is no difference between the 2 Tickers, the EMA is visible though)
If you use both "Compare (RSI) Ticker 3x" AND "Compare (RSI) MACD", of course be aware that you have the same Ticker 2 or 3 in each indicator!
Notes de version
The source is enhanced
Default source = "close" but can be changed to source = "volume"
- Settings > Inputs >
"ON = source 'close' OFF = source 'volume'"
Notes de version
When source = "close" , instead of only "close"you now have the full options of:
"Open", "High", "Low", "Close", "HL2", "HLC3", "OHLC4", ...
Notes de version
v4 - v5Script open-source
Dans l'esprit TradingView, le créateur de ce script l'a rendu open source afin que les traders puissent examiner et vérifier ses fonctionnalités. Bravo à l'auteur! Bien que vous puissiez l'utiliser gratuitement, n'oubliez pas que la republication du code est soumise à nos Règles.
Who are PineCoders?
tradingview.com/chart/SSP/yW5eOqtm-Who-are-PineCoders/
TG Pine Script® Q&A: t.me/PineCodersQA
- We cannot control our emotions,
but we can control our keyboard -
tradingview.com/chart/SSP/yW5eOqtm-Who-are-PineCoders/
TG Pine Script® Q&A: t.me/PineCodersQA
- We cannot control our emotions,
but we can control our keyboard -
Clause de non-responsabilité
Les informations et publications ne sont pas destinées à être, et ne constituent pas, des conseils ou recommandations financiers, d'investissement, de trading ou autres fournis ou approuvés par TradingView. Pour en savoir plus, consultez les Conditions d'utilisation.
Script open-source
Dans l'esprit TradingView, le créateur de ce script l'a rendu open source afin que les traders puissent examiner et vérifier ses fonctionnalités. Bravo à l'auteur! Bien que vous puissiez l'utiliser gratuitement, n'oubliez pas que la republication du code est soumise à nos Règles.
Who are PineCoders?
tradingview.com/chart/SSP/yW5eOqtm-Who-are-PineCoders/
TG Pine Script® Q&A: t.me/PineCodersQA
- We cannot control our emotions,
but we can control our keyboard -
tradingview.com/chart/SSP/yW5eOqtm-Who-are-PineCoders/
TG Pine Script® Q&A: t.me/PineCodersQA
- We cannot control our emotions,
but we can control our keyboard -
Clause de non-responsabilité
Les informations et publications ne sont pas destinées à être, et ne constituent pas, des conseils ou recommandations financiers, d'investissement, de trading ou autres fournis ou approuvés par TradingView. Pour en savoir plus, consultez les Conditions d'utilisation.