PROTECTED SOURCE SCRIPT
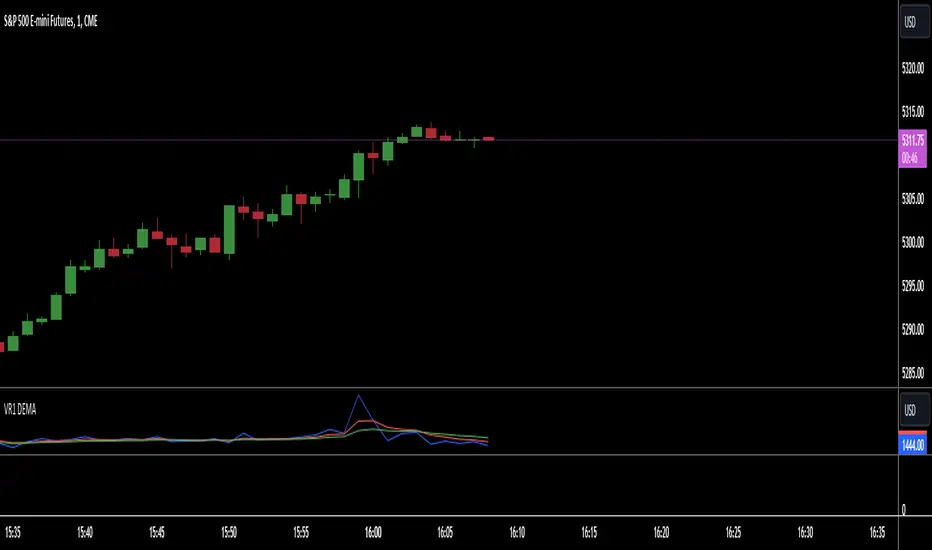
VR1 DEMA

Sure, here's a description for the "Volume Range Dual EMA" indicator:
---
**Indicator Name:** Volume Range Dual EMA
**Description:**
The "Volume Range Dual EMA" indicator is a technical analysis tool designed for TradingView charts. It calculates the ratio of volume to the price range of each bar and plots two Exponential Moving Averages (EMAs) of this ratio.
**Usage:**
- This indicator helps traders analyze the relationship between volume and price range in a given timeframe.
- The primary purpose of the indicator is to identify trends and potential changes in market sentiment based on volume and price movements.
- Traders can adjust the lengths of the EMAs according to their trading strategies and preferences.
- When the shorter EMA crosses above the longer EMA, it may signal a bullish trend, whereas a crossover in the opposite direction could indicate a bearish trend.
**Parameters:**
1. **EMA Length 1:** Defines the length of the first Exponential Moving Average (EMA) used in the calculation.
2. **EMA Length 2:** Defines the length of the second Exponential Moving Average (EMA) used in the calculation.
Script protégé
Ce script est publié en source fermée. Toutefois, vous pouvez l'utiliser librement et sans aucune restriction - en savoir plus ici.
Clause de non-responsabilité
Les informations et les publications ne sont pas destinées à être, et ne constituent pas, des conseils ou des recommandations en matière de finance, d'investissement, de trading ou d'autres types de conseils fournis ou approuvés par TradingView. Pour en savoir plus, consultez les Conditions d'utilisation.