OPEN-SOURCE SCRIPT
Mis à jour Elliott Wave Oscillator + TTM Squeeze
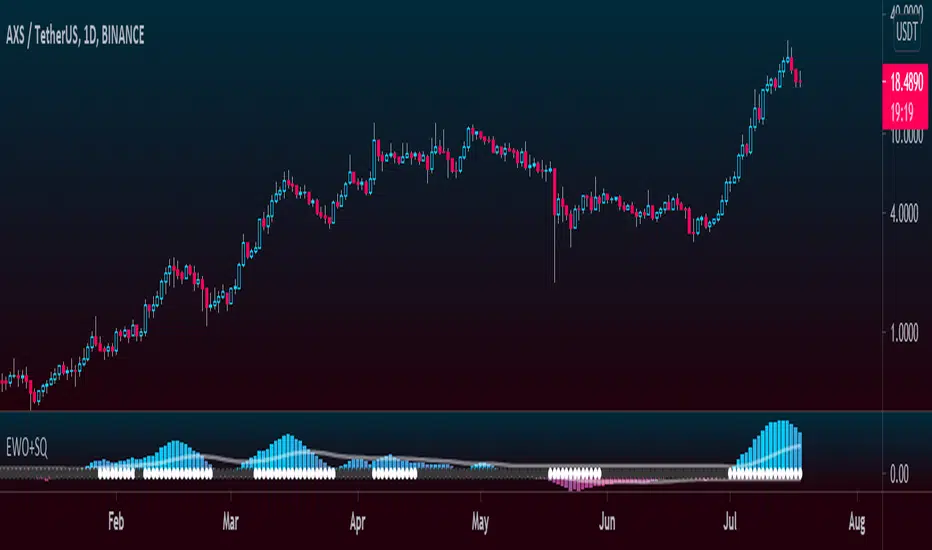
The Elliott Wave Oscillator enables traders to track Elliott Wave counts and divergences. It allows traders to observe when an existing wave ends and when a new one begins. It works on the basis of a simple calculation: The difference between a 5-period simple moving average and a 34-period simple moving average.
Included with the EWO are the breakout bands that help identify strong impulses.
To further aid in the detection of explosive movements I've included the TTM Squeeze indicator which shows the relationship between Keltner Channels & Bollinger Bands, wich highlight situations of compression/low volatility, and expansion/high volatility. The dark dots indicate a squeeze, and white dots indicates the end of such squeeze and therefore the start of an expansion.
Enjoy!
Notes de version
Added the options to choose the color of the Breakout Bands and the color of the squeeze indicator.Notes de version
Zero line color setting added.Script open-source
Dans l'esprit TradingView, le créateur de ce script l'a rendu open source afin que les traders puissent examiner et vérifier ses fonctionnalités. Bravo à l'auteur! Bien que vous puissiez l'utiliser gratuitement, n'oubliez pas que la republication du code est soumise à nos Règles.
@FractalTrade_
Clause de non-responsabilité
Les informations et publications ne sont pas destinées à être, et ne constituent pas, des conseils ou recommandations financiers, d'investissement, de trading ou autres fournis ou approuvés par TradingView. Pour en savoir plus, consultez les Conditions d'utilisation.
Script open-source
Dans l'esprit TradingView, le créateur de ce script l'a rendu open source afin que les traders puissent examiner et vérifier ses fonctionnalités. Bravo à l'auteur! Bien que vous puissiez l'utiliser gratuitement, n'oubliez pas que la republication du code est soumise à nos Règles.
@FractalTrade_
Clause de non-responsabilité
Les informations et publications ne sont pas destinées à être, et ne constituent pas, des conseils ou recommandations financiers, d'investissement, de trading ou autres fournis ou approuvés par TradingView. Pour en savoir plus, consultez les Conditions d'utilisation.