OPEN-SOURCE SCRIPT
Mis à jour Day High/Low and Horizontal Lines with Custom Increments

How It Works:
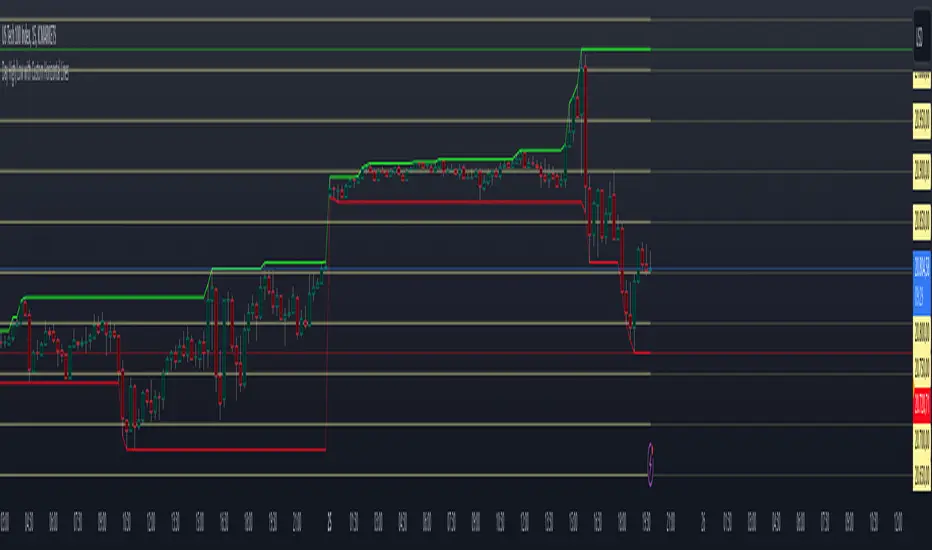
Day High and Day Low: The indicator tracks and displays the highest and lowest prices of the current trading day. These values are updated dynamically throughout the day.
Custom Horizontal Lines: The user specifies a starting price and an increment value. The indicator then plots multiple horizontal lines above and below the starting price, spaced at the given increment. Up to 15 lines can be drawn in both directions (above and below).
Alerts: Alerts are triggered when the price crosses any of the horizontal lines, helping traders monitor potential breakouts or reversals.
Use Case:
This indicator is useful for traders who want to:
Track the Day High/Low: Easily reference the high and low of the current day as key price levels.
Monitor Key Price Levels: Draw and observe custom horizontal levels above and below a specific price, such as support/resistance levels or price targets.
Set Alerts: Receive notifications when the price crosses these key levels, helping identify potential breakout or breakdown points in the market.
Why Use This Indicator:
Day Trading: Traders can monitor the high and low of the current trading day to see if the price breaks through key levels.
Breakout Strategy: The custom horizontal lines provide reference points for potential breakout levels, with alerts helping traders act in real-time.
Support and Resistance: The plotted lines can represent predefined support or resistance levels, allowing traders to plan their entries and exits effectively.
The indicator gives a structured way to visualize price movements, highlight important price levels, and react quickly with alerts when the price crosses those levels.
Notes de version
Explanation of the IndicatorThe "Day High/Low with Custom Horizontal Lines" indicator displays:
Daily High and Low:
The highest and lowest prices of the current day are shown as lines on the chart.
These lines help identify key support and resistance levels for the day.
Custom Horizontal Lines:
You can define a starting price (selectedprice) from which several horizontal lines are drawn.
The spacing between these lines is adjustable using the incval value (e.g., 10, 20, or other values).
Lines are calculated both above and below the starting price.
Colors and Line Width:
Three predefined color sets are available for selection.
Line width is adjustable (1-5).
Practical Use:
Visualize support and resistance levels.
Analyze price movements relative to daily highs/lows and custom levels.
Customizable to fit individual trading strategies.
Script open-source
Dans l'esprit TradingView, le créateur de ce script l'a rendu open source afin que les traders puissent examiner et vérifier ses fonctionnalités. Bravo à l'auteur! Bien que vous puissiez l'utiliser gratuitement, n'oubliez pas que la republication du code est soumise à nos Règles.
Clause de non-responsabilité
Les informations et publications ne sont pas destinées à être, et ne constituent pas, des conseils ou recommandations financiers, d'investissement, de trading ou autres fournis ou approuvés par TradingView. Pour en savoir plus, consultez les Conditions d'utilisation.