PROTECTED SOURCE SCRIPT
Mis à jour Bitcoin Heatmap (by Alex L.)
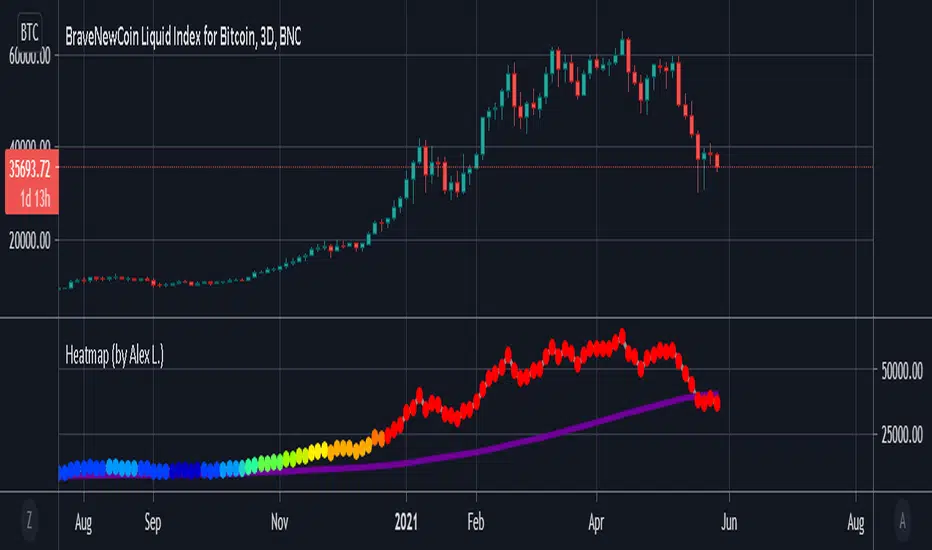
This indicator is a based on "200 Week Moving Average Heatmap" by Plan B. It shows "heatmap" of a security based on % increase of its 200 week (or other) moving average. It can be used for Bitcoin, as well identifying overheated Stocks (like TSLA). Plan B designed this indicator for Bitcoin using MA = 1400 (which is 200 trading days in Crypto), I personally found it useful to indicate overheated Stock Market stocks using MA = 250 (which is ~1 year of net trading days, excluding weekends and holidays).
Enjoy!
Enjoy!
Notes de version
Fix for edge case where if smaller MA was used (not the default 1400) and if MA % of a certain bar was more than 100% then "Heatmap" circle would not be painted in "red", now it will be.Script protégé
Ce script est publié en source fermée. Cependant, vous pouvez l'utiliser librement et sans aucune restriction – pour en savoir plus, cliquez ici.
Clause de non-responsabilité
Les informations et publications ne sont pas destinées à être, et ne constituent pas, des conseils ou recommandations financiers, d'investissement, de trading ou autres fournis ou approuvés par TradingView. Pour en savoir plus, consultez les Conditions d'utilisation.
Script protégé
Ce script est publié en source fermée. Cependant, vous pouvez l'utiliser librement et sans aucune restriction – pour en savoir plus, cliquez ici.
Clause de non-responsabilité
Les informations et publications ne sont pas destinées à être, et ne constituent pas, des conseils ou recommandations financiers, d'investissement, de trading ou autres fournis ou approuvés par TradingView. Pour en savoir plus, consultez les Conditions d'utilisation.