OPEN-SOURCE SCRIPT
Mis à jour Fixed RSI Overlay [lognomics]
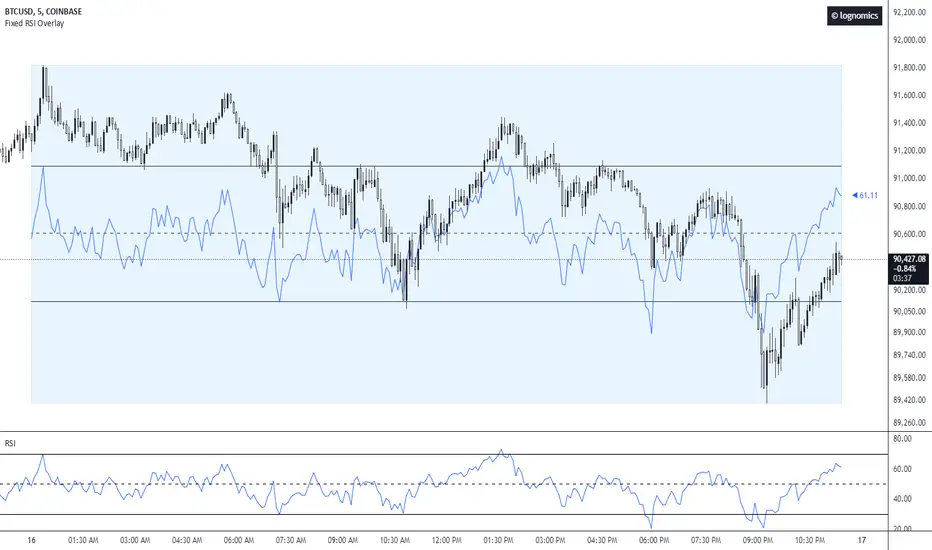
This overlay indicator provides a dynamic visualization of the RSI on the instrument price chart. It enhances the standard RSI oscillator by scaling it relative to the anchor's maximum & minimum range, conceptualizing how price reacts at standard oscillation levels.
Starting at the anchor's open, the tool collects all the RSI values from each candle within the range, and stores them inside an array corresponding to each candle index. It then pulls relative values and plots a line connecting each point accordingly to the 0-100 range scale.
While determining each maximum and/or minimum the script will plot a box from the opening time of the anchor, encapsulating the high & low of the range, to end at the next anchor time. To the right to of the box, a label is plotted which is pushed to the current time & current RSI y value within the fixed scale.
Notes de version
Universal time-zone input & styling.Notes de version
Bug fixes.Notes de version
Lookback bar anchor & stochastic plot setting.Script open-source
Dans l'esprit TradingView, le créateur de ce script l'a rendu open source afin que les traders puissent examiner et vérifier ses fonctionnalités. Bravo à l'auteur! Bien que vous puissiez l'utiliser gratuitement, n'oubliez pas que la republication du code est soumise à nos Règles.
Clause de non-responsabilité
Les informations et publications ne sont pas destinées à être, et ne constituent pas, des conseils ou recommandations financiers, d'investissement, de trading ou autres fournis ou approuvés par TradingView. Pour en savoir plus, consultez les Conditions d'utilisation.
Script open-source
Dans l'esprit TradingView, le créateur de ce script l'a rendu open source afin que les traders puissent examiner et vérifier ses fonctionnalités. Bravo à l'auteur! Bien que vous puissiez l'utiliser gratuitement, n'oubliez pas que la republication du code est soumise à nos Règles.
Clause de non-responsabilité
Les informations et publications ne sont pas destinées à être, et ne constituent pas, des conseils ou recommandations financiers, d'investissement, de trading ou autres fournis ou approuvés par TradingView. Pour en savoir plus, consultez les Conditions d'utilisation.