OPEN-SOURCE SCRIPT
Mis à jour PE Band

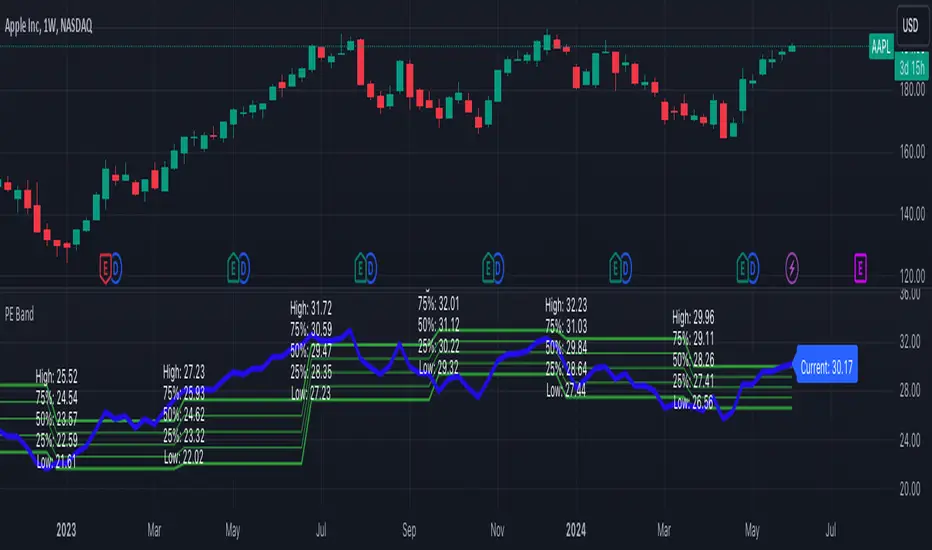
The PE Band shows the highest and lowest P/E in the previous period with TTM EPS. If the current P/E is lower than the minimum P/E, it is considered cheap. In other words, higher than the maximum P/E is considered expensive.
PE Band consists of 2 lines.
- Firstly, the historical P/E value in "green" (if TTM EPS is positive) or "red" (if TTM EPS is negative) states will change according to the latest high or low price of TTM EPS, such as: :
After the second quarter of 2023 (end of June), how do prices from 1 July – 30 September reflect net profits? The program will get the highest and lowest prices during that time.
After the 3rd quarter of 2023 (end of September), how do prices from 1 Oct. - 31 Dec. reflect net profits? The program will get the highest and lowest prices during that time.
- Second, the blue line is the closing price divided by TTM EPS, which shows the current P/E.
Notes de version
1. Change from "EARNINGS_PER_SHARE" to "EARNINGS_PER_SHARE_DILUTED"2. Add more lines of 75% P/E and 25% P/E
Notes de version
to solve Error on bar 5000 as comment - Add attribute "calc_bars_count = 5000" in indicator
Script open-source
Dans l'esprit TradingView, le créateur de ce script l'a rendu open source afin que les traders puissent examiner et vérifier ses fonctionnalités. Bravo à l'auteur! Bien que vous puissiez l'utiliser gratuitement, n'oubliez pas que la republication du code est soumise à nos Règles.
Clause de non-responsabilité
Les informations et publications ne sont pas destinées à être, et ne constituent pas, des conseils ou recommandations financiers, d'investissement, de trading ou autres fournis ou approuvés par TradingView. Pour en savoir plus, consultez les Conditions d'utilisation.