OPEN-SOURCE SCRIPT
Bollinger Bands cross %
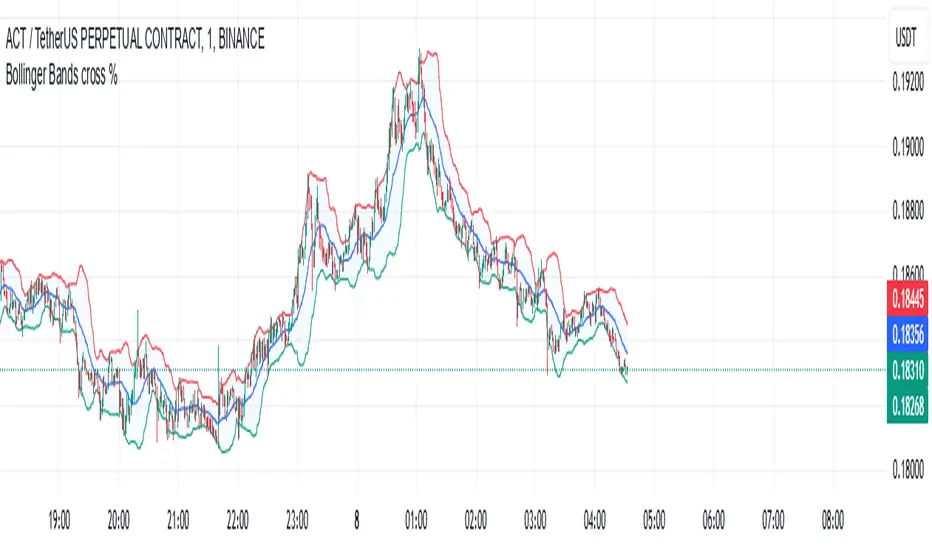
The BB strategy (Bollinger Bands strategy) on TradingView utilizes the Bollinger Bands indicator to help traders identify market volatility and potential entry points. The Bollinger Bands indicator consists of three main components:
Middle Band: This is the simple moving average (SMA), usually calculated over a 20-period. It represents the average price over a specific period.
Upper Band and Lower Band: These bands are created by adding and subtracting a multiple of the standard deviation (typically 2) from the middle band. The upper and lower bands help determine the level of price volatility.
How the BB Strategy Works:
Break above the Upper Band: When the price moves above the upper band, it might signal that the market is in an "overbought" condition. This could be a sign to consider selling, but it could also continue if the trend is strong.
Break below the Lower Band: When the price moves below the lower band, it might signal that the market is in an "oversold" condition, which could be a signal to buy if the trend is reversing.
Squeeze (Coiling): When the Bollinger Bands contract, often referred to as a "squeeze," it indicates that the market may be preparing for a strong price move. This is a critical signal in the BB strategy because the narrowing bands signify low volatility and a potential breakout in price.
Specific Strategy:
Buy when price touches the lower band and shows signs of reversal (bullish reversal): If the price touches the lower band, you might wait for a reversal signal, such as a bullish candlestick pattern or confirmation from other indicators like RSI or MACD, indicating oversold conditions.
Sell when price touches the upper band and shows signs of reversal (bearish reversal): Similarly, when the price touches the upper band, you could wait for a bearish reversal signal, such as a bearish candlestick pattern or confirmation from other indicators, and then sell.
Trend-following when bands are expanding: If the Bollinger Bands are expanding and the price continues in the same direction, it could signal a trend-following opportunity.
Script open-source
Dans l'esprit TradingView, le créateur de ce script l'a rendu open source afin que les traders puissent examiner et vérifier ses fonctionnalités. Bravo à l'auteur! Bien que vous puissiez l'utiliser gratuitement, n'oubliez pas que la republication du code est soumise à nos Règles.
Clause de non-responsabilité
Les informations et publications ne sont pas destinées à être, et ne constituent pas, des conseils ou recommandations financiers, d'investissement, de trading ou autres fournis ou approuvés par TradingView. Pour en savoir plus, consultez les Conditions d'utilisation.