OPEN-SOURCE SCRIPT
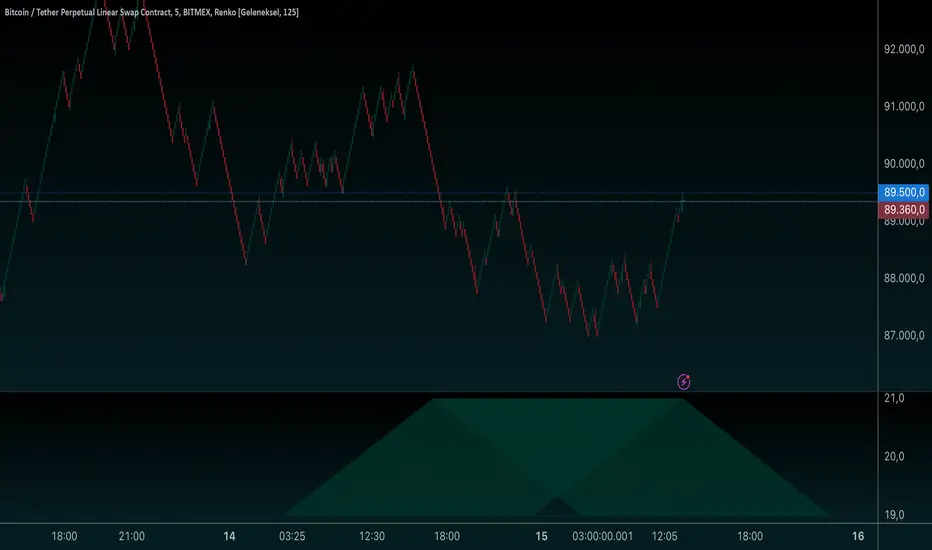
Platonic Solids Visualization-Scret Geometry-AYNET

Explanation:
Input Options:
solid: Choose the type of Platonic Solid (Tetrahedron, Cube, Octahedron, etc.).
size: Adjust the size of the geometry.
color_lines: Choose the color for the edges.
line_width: Set the width of the edges.
Geometry Calculations:
Each solid is drawn based on predefined coordinates and connected using the line.new function.
Geometric Types Supported:
Tetrahedron: A triangular pyramid.
Cube: A square-based 2D projection.
Octahedron: Two pyramids joined at the base.
Unsupported Solids:
Dodecahedron and Icosahedron are geometrically more complex and not rendered in this basic implementation.
Visualization:
The chosen Platonic Solid will be drawn relative to the center position (center_y) on the chart.
Adjust the size and center_y inputs to position the shape correctly.
Let me know if you need improvements or have a specific geometry to implement!
Script open-source
Dans l'esprit TradingView, le créateur de ce script l'a rendu open source afin que les traders puissent examiner et vérifier ses fonctionnalités. Bravo à l'auteur! Bien que vous puissiez l'utiliser gratuitement, n'oubliez pas que la republication du code est soumise à nos Règles.
Clause de non-responsabilité
Les informations et publications ne sont pas destinées à être, et ne constituent pas, des conseils ou recommandations financiers, d'investissement, de trading ou autres fournis ou approuvés par TradingView. Pour en savoir plus, consultez les Conditions d'utilisation.