PROTECTED SOURCE SCRIPT
Mis à jour Thunderbird Volcano & Waterfall Signals
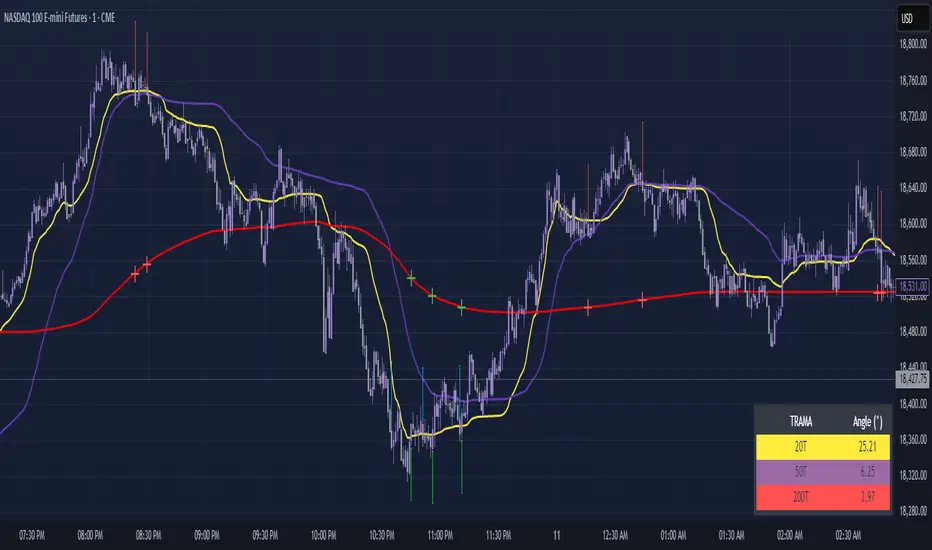
The Thunderbird Volcano & Waterfall signal Indicator is a strategy that incorporates the use of Price Action and TRAMA positioning to determine entry and exit points. There are 3 scenarios in which the indicator will signal an entry and exit if applicable. Keep in mind the suggested entry and exit points must be taken as consideration; further confirmations such as TRAMA pointing down or up, market structure, IFVG, etc. should be used in order for a successful trade.
Scenario 1 (SHORT) is the Thunderbird Volcano setup, TRAMA alignment is in accordance with the Volcano setup; A red arrow above will indicate entry when a candle closes below the 20T and a red cross will indicate the potential target at the 200T.
Scenario 2 (SHORT) is the Thunderbird Waterfall setup, TRAMA alignment is in accordance with the Waterfall setup; A blue arrow above will indicate entry when a candle closes below all 3 TRAMAs after corresponding position is established. Target is not indicated and can vary according to user specification.
Scenario 3 (LONG) is the Inverse Volcano setup, TRAMA alignment is in accordance with the Inverse Volcano setup. A green arrow will indicate entry below when a candle closes above the 20T and a green cross will indicate the potential target at the 200T.
Notes de version
The Thunderbird Volcano & Waterfall signal Indicator is a strategy that incorporates the use of Price Action and TRAMA positioning to determine entry and exit points. There are 3 scenarios in which the indicator will signal an entry and exit if applicable. Keep in mind the suggested entry and exit points must be taken as consideration; further confirmations such as TRAMA pointing down or up, market structure, IFVG, etc. should be used in order for a successful trade.Scenario 1 (SHORT) is the Thunderbird Volcano setup, TRAMA alignment is in accordance with the Volcano setup; A red arrow above will indicate entry when a candle closes below the 20T and a red cross will indicate the potential target at the 200T.
Scenario 2 (SHORT) is the Thunderbird Waterfall setup, TRAMA alignment is in accordance with the Waterfall setup; A blue arrow above will indicate entry when a candle closes below all 3 TRAMAs after corresponding position is established. Target is not indicated and can vary according to user specification.
Scenario 3 (LONG) is the Thunderbird Inverse Volcano setup, TRAMA alignment is in accordance with the Inverse Volcano setup. A green arrow will indicate entry below when a candle closes above the 20T and a green cross will indicate the potential target at the 200T.
Notes de version
The Thunderbird Volcano & Waterfall signal Indicator is a strategy that incorporates the use of Price Action and TRAMA positioning to determine entry and exit points. There are 3 scenarios in which the indicator will signal an entry and exit if applicable. Keep in mind the suggested entry and exit points must be taken as consideration; further confirmations such as TRAMA pointing down or up, market structure, IFVG, etc. should be used in order for a successful trade.Scenario 1 (SHORT) is the Thunderbird Volcano setup, TRAMA alignment is in accordance with the Volcano setup; A red arrow above will indicate entry when a candle closes below the 20T and a red cross will indicate the potential target at the 200T.
Scenario 2 (SHORT) is the Thunderbird Waterfall setup, TRAMA alignment is in accordance with the Waterfall setup; A blue arrow above will indicate entry when a candle closes below all 3 TRAMAs after corresponding position is established. Target is not indicated and can vary according to user specification.
Scenario 3 (LONG) is the Inverse Volcano setup, TRAMA alignment is in accordance with the Inverse Volcano setup. A green arrow will indicate entry below when a candle closes above the 20T and a green cross will indicate the potential target at the 200T.
V2 Update:
-Includes TRAMA angle table in degrees to monitor current TRAMA angle for confirmed trend.
-User adjustable settings to show/hide selected scenarios on the chart.
Notes de version
Updated script for arrow placements.Script protégé
Ce script est publié en source fermée. Cependant, vous pouvez l'utiliser librement et sans aucune restriction – pour en savoir plus, cliquez ici.
Clause de non-responsabilité
Les informations et publications ne sont pas destinées à être, et ne constituent pas, des conseils ou recommandations financiers, d'investissement, de trading ou autres fournis ou approuvés par TradingView. Pour en savoir plus, consultez les Conditions d'utilisation.
Script protégé
Ce script est publié en source fermée. Cependant, vous pouvez l'utiliser librement et sans aucune restriction – pour en savoir plus, cliquez ici.
Clause de non-responsabilité
Les informations et publications ne sont pas destinées à être, et ne constituent pas, des conseils ou recommandations financiers, d'investissement, de trading ou autres fournis ou approuvés par TradingView. Pour en savoir plus, consultez les Conditions d'utilisation.