PROTECTED SOURCE SCRIPT
VIX Termstructure Indicator (Overlay)
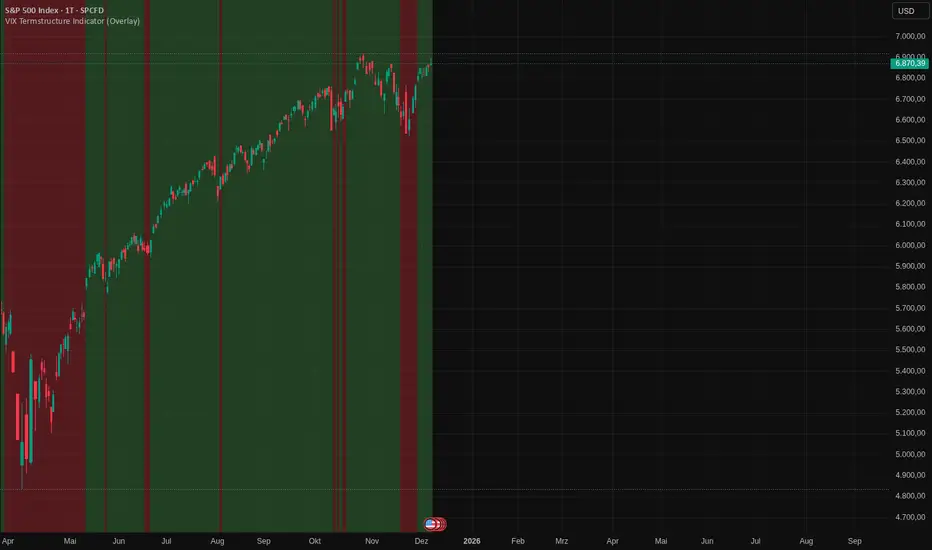
This indicator visualizes the VIX futures term structure directly on your chart background and highlights three key volatility regimes using color coding. It helps identify when the volatility curve is in normal contango, inverted (backwardation), or undergoing a curve flip between the front-month VIX futures.
What the indicator does
The script pulls and compares:
All data is requested on the daily timeframe and used to classify the current volatility environment. The indicator then colors the background of your chart according to the detected VIX term structure:
Green background – Contango:
VIX spot is below the front-month futures (VIX < VX1!).
This is typically associated with more “normal” market conditions and lower perceived short-term stress.
Red background – Inverted curve (Backwardation):
VIX spot is above the front-month futures (VIX > VX1!).
This often signals elevated fear, stress, or risk-off conditions in the market.
Yellow background – Curve flip between VX1! and VX2!:
The front-month futures are trading above the second-month futures (VX1! > VX2!).
This can indicate a transition phase in the volatility term structure and may precede or accompany shifts in market sentiment.
How it works
The script fetches the daily close values of VIX, VX1!, and VX2!. It checks whether the front-month futures are above the second-month futures to detect a curve flip. It compares VIX with VX1! to determine if the curve is contango or inverted. Based on these conditions, the chart background is colored with a semi-transparent overlay:
Use cases
This overlay is designed as a context tool for indices, ETFs, Options, or individual stocks that are sensitive to volatility and risk sentiment. Typical applications include:
Identifying periods of heightened risk (red / inverted curve) to adjust position sizing or risk exposure.
Notes
What the indicator does
The script pulls and compares:
- VIX spot index: VIX
- Front-month VIX futures: VX1!
- Second-month VIX futures: VX2!
All data is requested on the daily timeframe and used to classify the current volatility environment. The indicator then colors the background of your chart according to the detected VIX term structure:
Green background – Contango:
VIX spot is below the front-month futures (VIX < VX1!).
This is typically associated with more “normal” market conditions and lower perceived short-term stress.
Red background – Inverted curve (Backwardation):
VIX spot is above the front-month futures (VIX > VX1!).
This often signals elevated fear, stress, or risk-off conditions in the market.
Yellow background – Curve flip between VX1! and VX2!:
The front-month futures are trading above the second-month futures (VX1! > VX2!).
This can indicate a transition phase in the volatility term structure and may precede or accompany shifts in market sentiment.
How it works
The script fetches the daily close values of VIX, VX1!, and VX2!. It checks whether the front-month futures are above the second-month futures to detect a curve flip. It compares VIX with VX1! to determine if the curve is contango or inverted. Based on these conditions, the chart background is colored with a semi-transparent overlay:
- Red has priority when VIX is above VX1! (inverted curve).
- If not inverted, yellow is shown when a curve flip VX1! > VX2! is detected.
- Otherwise, the background is green (normal contango).
Use cases
This overlay is designed as a context tool for indices, ETFs, Options, or individual stocks that are sensitive to volatility and risk sentiment. Typical applications include:
Identifying periods of heightened risk (red / inverted curve) to adjust position sizing or risk exposure.
- Confirming risk-on environments (green / contango) where volatility is more contained.
- Monitoring yellow curve-flip phases as potential early warnings of changing volatility regimes.
- The indicator does not generate buy/sell signals on its own, but it can be a valuable regime filter or confirmation layer alongside other technical tools.
Notes
- This is an overlay indicator: it colors the background of your active chart.
- All VIX-related data is evaluated on the daily timeframe, regardless of the chart timeframe.
- Make sure that the symbols VIX, VX1!, and VX2! are available on your broker/data feed in TradingView.
Script protégé
Ce script est publié en source fermée. Cependant, vous pouvez l'utiliser librement et sans aucune restriction – pour en savoir plus, cliquez ici.
Clause de non-responsabilité
Les informations et publications ne sont pas destinées à être, et ne constituent pas, des conseils ou recommandations financiers, d'investissement, de trading ou autres fournis ou approuvés par TradingView. Pour en savoir plus, consultez les Conditions d'utilisation.