DiNapoli DMA Table
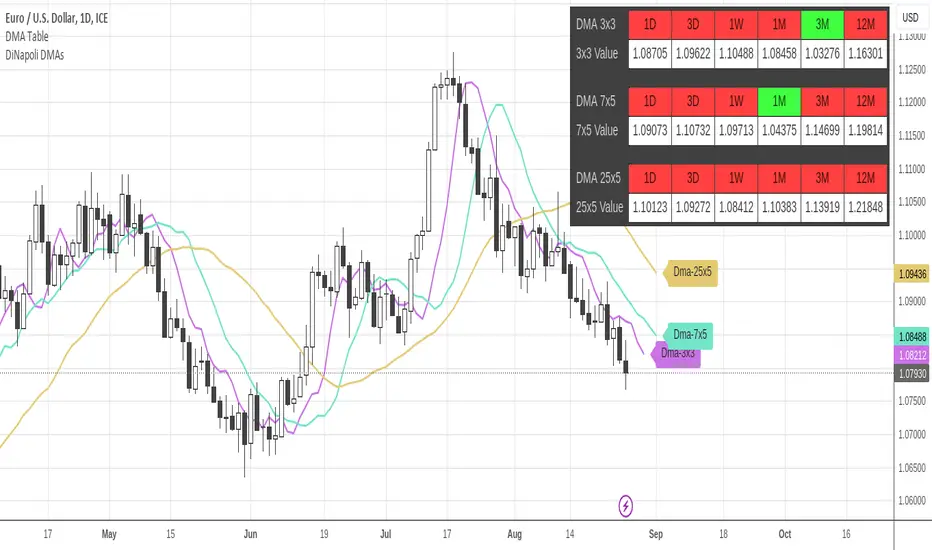
Only Higher Timeframes states do appear in the table. Lower Timeframes are grayed out, due to inability to get reliable results for such behaviour in current Tradingview environment.
The position of the table can be customized through the input panel.
Note: This indicator is demanding in terms of resources, and it might take some seconds to fully populate the table.
- Timeframes being displayed in the table are open to be selected.
- By default only 5 timeframes get activated: 1H, 4H, 1D, 1W and 1M
- Lower and deactivated timeframes don't appear in the table. That makes contributes to a cleaner chart space.
- Added the ability to monitor yearly (12M) timeframe.
- Timeframes display can be rendered in Ascending or Descending sorting.
Script sur invitation seulement
Seuls les utilisateurs approuvés par l'auteur peuvent accéder à ce script. Vous devrez demander et obtenir l'autorisation pour l'utiliser. Celle-ci est généralement accordée après paiement. Pour plus de détails, suivez les instructions de l'auteur ci-dessous ou contactez directement gliderfund.
TradingView ne recommande PAS d'acheter ou d'utiliser un script à moins que vous ne fassiez entièrement confiance à son auteur et que vous compreniez son fonctionnement. Vous pouvez également trouver des alternatives gratuites et open source dans nos scripts communautaires.
Instructions de l'auteur
Clause de non-responsabilité
Script sur invitation seulement
Seuls les utilisateurs approuvés par l'auteur peuvent accéder à ce script. Vous devrez demander et obtenir l'autorisation pour l'utiliser. Celle-ci est généralement accordée après paiement. Pour plus de détails, suivez les instructions de l'auteur ci-dessous ou contactez directement gliderfund.
TradingView ne recommande PAS d'acheter ou d'utiliser un script à moins que vous ne fassiez entièrement confiance à son auteur et que vous compreniez son fonctionnement. Vous pouvez également trouver des alternatives gratuites et open source dans nos scripts communautaires.