OPEN-SOURCE SCRIPT
Smart Dynamic Stop Loss (SDSL) Indicator
Smart Dynamic Stop Loss (SDSL) Indicator
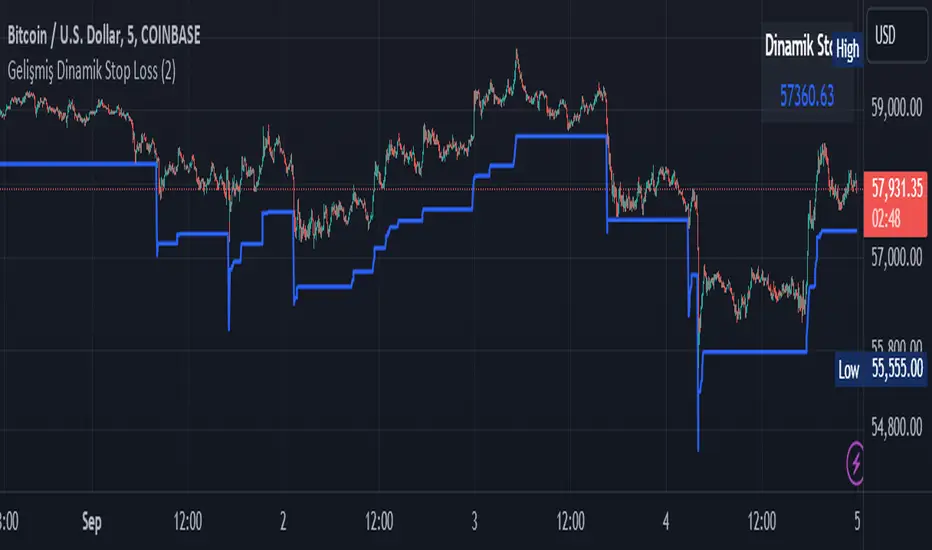
The Smart Dynamic Stop Loss (SDSL) Indicator creates a stop loss level that dynamically adapts to market conditions.
How It Works / How To Calculate:
1. **Initialization**: The indicator initially sets a stop loss level at a specified percentage (default 2%, user-adjustable) below the current price.
2. **Upward Movement**: As the price rises, the stop loss level moves up as well. However, it always remains at the specified percentage below the highest price reached. This allows the price room to move while protecting gains.
3. **Downward or Sideways Movement**: When the price falls or moves sideways, the stop loss level remains static. This prevents premature exits during minor pullbacks or consolidations.
4. **Price Crosses Below Stop Loss**: If the price drops below the stop loss level, the indicator resets. It sets a new stop loss level at the specified percentage below the low of the candle where the crossover occurred.
5. **Continuous Adaptation**: This process repeats across the entire chart, constantly adjusting to price movements.
note: When the price intersects with the dynamic stop loss line, it resets at 2% below the candle's lowest value (this is the default value, but it can be adjusted by the user)
Key Features
- **User-Configurable**: The stop loss percentage can be adjusted by the user.
- **Visual Alerts**: The indicator plots the stop loss line on the chart.
- **Triggered Signals**: Optional visual signals are displayed when the stop loss is triggered.
- **Information Display**: A data box shows the current stop loss level.
Usage
1. Apply the indicator to the chart.
2. Adjust the stop loss percentage if desired (default is 2%).
3. Monitor the dynamic stop loss level.
4. Watch for visual alerts for potential signals.
Script open-source
Dans l'esprit TradingView, le créateur de ce script l'a rendu open source afin que les traders puissent examiner et vérifier ses fonctionnalités. Bravo à l'auteur! Bien que vous puissiez l'utiliser gratuitement, n'oubliez pas que la republication du code est soumise à nos Règles.
Clause de non-responsabilité
Les informations et publications ne sont pas destinées à être, et ne constituent pas, des conseils ou recommandations financiers, d'investissement, de trading ou autres fournis ou approuvés par TradingView. Pour en savoir plus, consultez les Conditions d'utilisation.