OPEN-SOURCE SCRIPT
Mis à jour Zone Strength [wbburgin]
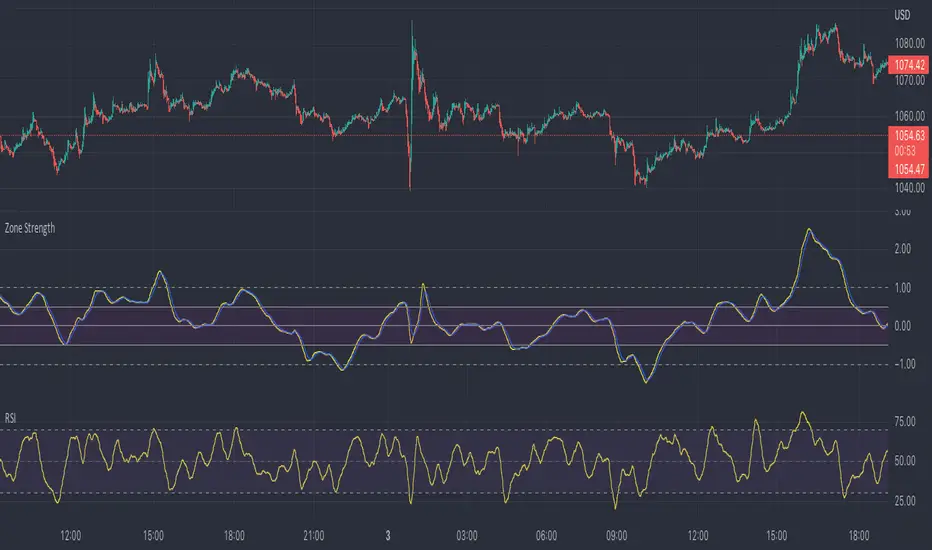
The Zone Strength indicator is a multifaceted indicator combining volatility-based, momentum-based, and support-based metrics to indicate where a trend reversal is likely.
I recommend using it with the RSI at normal settings to confirm entrances and exits.
The indicator first uses a candle’s wick in relation to its body, depending on whether it closes green or red, to determine ranges of volatility.
The maxima of these volatility statistics are registered across a specific period (the “amplitude”) to determine regions of current support.
The “wavelength” of this statistic is taken to smooth out the Zone Strength’s final statistic.
Finally, the ratio of the difference between the support and the resistance levels is taken in relation to the candle to determine how close the candle is to the “Buy Zone” (<-0.5) or the “Sell Zone” (>0.5).
wbburgin
Notes de version
Option to not show tertiary resistance lines (and make the plot appear easier to see).Notes de version
Ease-of-use update! Added a bunch of customizable MA features and made the interface easier to change.Script open-source
Dans l'esprit TradingView, le créateur de ce script l'a rendu open source afin que les traders puissent examiner et vérifier ses fonctionnalités. Bravo à l'auteur! Bien que vous puissiez l'utiliser gratuitement, n'oubliez pas que la republication du code est soumise à nos Règles.
FAQ: I am gradually phasing out my Patreon because of the time it takes to maintain.
BTC: 35PdMMMXFCvPjXKwn8wsRFNwMEPgStaKUJ
Test my strategies on CryptoRobotics: cryptorobotics.co/?trade=f23b09
BTC: 35PdMMMXFCvPjXKwn8wsRFNwMEPgStaKUJ
Test my strategies on CryptoRobotics: cryptorobotics.co/?trade=f23b09
Clause de non-responsabilité
Les informations et publications ne sont pas destinées à être, et ne constituent pas, des conseils ou recommandations financiers, d'investissement, de trading ou autres fournis ou approuvés par TradingView. Pour en savoir plus, consultez les Conditions d'utilisation.
Script open-source
Dans l'esprit TradingView, le créateur de ce script l'a rendu open source afin que les traders puissent examiner et vérifier ses fonctionnalités. Bravo à l'auteur! Bien que vous puissiez l'utiliser gratuitement, n'oubliez pas que la republication du code est soumise à nos Règles.
FAQ: I am gradually phasing out my Patreon because of the time it takes to maintain.
BTC: 35PdMMMXFCvPjXKwn8wsRFNwMEPgStaKUJ
Test my strategies on CryptoRobotics: cryptorobotics.co/?trade=f23b09
BTC: 35PdMMMXFCvPjXKwn8wsRFNwMEPgStaKUJ
Test my strategies on CryptoRobotics: cryptorobotics.co/?trade=f23b09
Clause de non-responsabilité
Les informations et publications ne sont pas destinées à être, et ne constituent pas, des conseils ou recommandations financiers, d'investissement, de trading ou autres fournis ou approuvés par TradingView. Pour en savoir plus, consultez les Conditions d'utilisation.