OPEN-SOURCE SCRIPT
Distribution_Accumulation_ChurningDay_StockUnderStress
Distribution days is a term related to distribution stock in the sense that heavy institutional selling of shares is taking place. A distribution day, technically speaking, occurs when major market indexes fall 0.2% or more on volume that is higher than the previous trading day.
A follow-through day occurs during a market correction when a major index closes 1% or higher than the previous day, and in greater volume.
Churning day occurs when there is little price progress despite strong volume. It indicates a stock under stress.
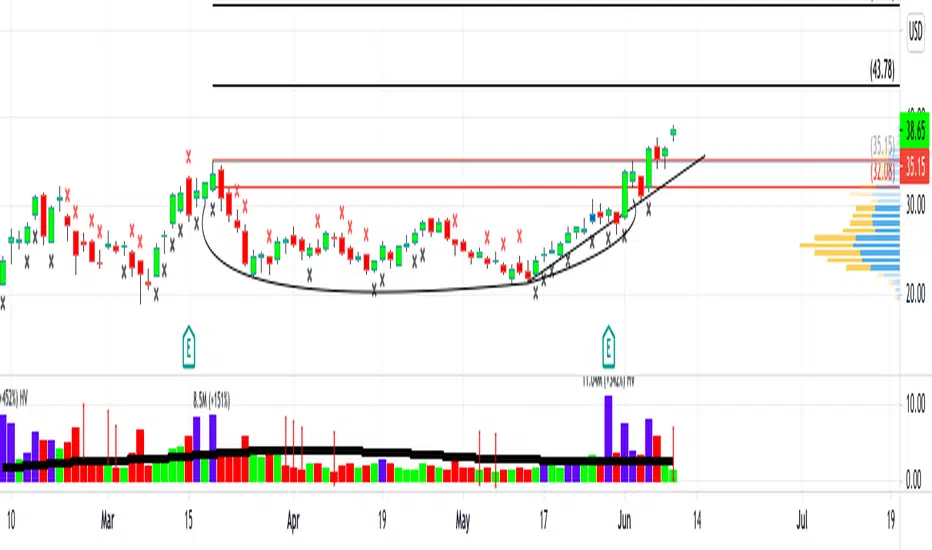
You can use the script below in TradingView to plot these on the chart
RED CROSS on top of the bar - High volume Red (Distribution)
Black CROSS on bottom of bar - High Volume Green day (Accumulation/ Follow through)
Blue Bar with Black Cross. - High Volume green day but closed 55% below the day days range. (Churning action)
Blue Bar - Stock had a green day but closed in lower bounds(55% below the day days range) i.e under stress
A follow-through day occurs during a market correction when a major index closes 1% or higher than the previous day, and in greater volume.
Churning day occurs when there is little price progress despite strong volume. It indicates a stock under stress.
You can use the script below in TradingView to plot these on the chart
RED CROSS on top of the bar - High volume Red (Distribution)
Black CROSS on bottom of bar - High Volume Green day (Accumulation/ Follow through)
Blue Bar with Black Cross. - High Volume green day but closed 55% below the day days range. (Churning action)
Blue Bar - Stock had a green day but closed in lower bounds(55% below the day days range) i.e under stress
Script open-source
Dans l'esprit TradingView, le créateur de ce script l'a rendu open source afin que les traders puissent examiner et vérifier ses fonctionnalités. Bravo à l'auteur! Bien que vous puissiez l'utiliser gratuitement, n'oubliez pas que la republication du code est soumise à nos Règles.
Clause de non-responsabilité
Les informations et publications ne sont pas destinées à être, et ne constituent pas, des conseils ou recommandations financiers, d'investissement, de trading ou autres fournis ou approuvés par TradingView. Pour en savoir plus, consultez les Conditions d'utilisation.