PROTECTED SOURCE SCRIPT
Long and Short Signal_1hours [zavaUnni]
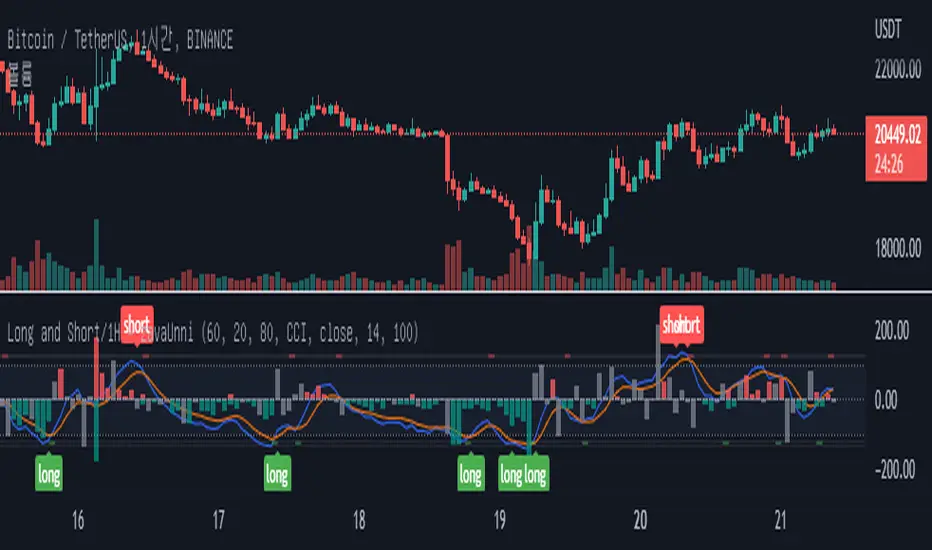
This indicator is available in the 1 hour chart.
The Stochastic value of 1 hour of 3 types of length was requested, summed, and then the value was derived.
The blue line is the K and the orange line is D of the Stochastic.
The default is Stochastic, but when RSI is selected in the settings, it can be viewed as the relative strength index of the Stochastic.


[Signal]
If the K value crosses down at 100, a short signal is generated
Cross up below -100 and you'll get a long signal.
You can receive a ready signal by checking Position Ready in Settings.
Short ready signal when the k line goes up to 100.
Long ready signal when the k line goes below -100.

[Histogram]
A small spread value of the candle relative to the volume is the principle that resistance has occurred.
Displayed the resistance value based on the average value of the last 100 candles.
The higher the value of the red Histogram, the stronger the selling.
The lower the value of the green Histogram value, the stronger the buying .
The gray histogram is when there's no buying or selling pressure.
The Stochastic value of 1 hour of 3 types of length was requested, summed, and then the value was derived.
The blue line is the K and the orange line is D of the Stochastic.
The default is Stochastic, but when RSI is selected in the settings, it can be viewed as the relative strength index of the Stochastic.
[Signal]
If the K value crosses down at 100, a short signal is generated
Cross up below -100 and you'll get a long signal.
You can receive a ready signal by checking Position Ready in Settings.
Short ready signal when the k line goes up to 100.
Long ready signal when the k line goes below -100.
[Histogram]
A small spread value of the candle relative to the volume is the principle that resistance has occurred.
Displayed the resistance value based on the average value of the last 100 candles.
The higher the value of the red Histogram, the stronger the selling.
The lower the value of the green Histogram value, the stronger the buying .
The gray histogram is when there's no buying or selling pressure.
Script protégé
Ce script est publié en source fermée. Cependant, vous pouvez l'utiliser librement et sans aucune restriction – pour en savoir plus, cliquez ici.
Clause de non-responsabilité
Les informations et publications ne sont pas destinées à être, et ne constituent pas, des conseils ou recommandations financiers, d'investissement, de trading ou autres fournis ou approuvés par TradingView. Pour en savoir plus, consultez les Conditions d'utilisation.