OPEN-SOURCE SCRIPT
Mis à jour ATR / Price Ratio
Description:
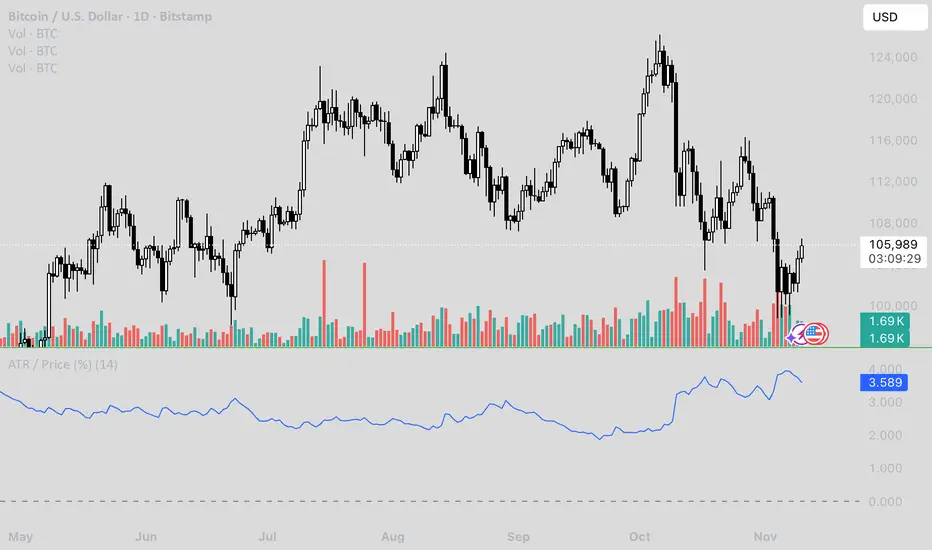
This indicator plots the ratio of the Average True Range (ATR) to the current price, showing volatility as a percentage of price rather than in absolute terms. It helps compare volatility across assets and timeframes by normalizing for price level.
A higher ATR/Price ratio means the market is moving a larger percentage of its value each bar (high relative volatility). A lower ratio indicates tighter, quieter price action (low relative volatility).
Traders can use this ratio to:
• Compare volatility between instruments
• Identify shifts into high or low volatility regimes
• Adjust position sizing and stop distances relative to risk
Notes de version
Description:This indicator plots the ratio of the Average True Range (ATR) to the current price, showing volatility as a percentage of price rather than in absolute terms. It helps compare volatility across assets and timeframes by normalizing for price level.
A higher ATR/Price ratio means the market is moving a larger percentage of its value each bar (high relative volatility). A lower ratio indicates tighter, quieter price action (low relative volatility).
Traders can use this ratio to:
• Compare volatility between instruments
• Identify shifts into high or low volatility regimes
• Adjust position sizing and stop distances relative to risk
Script open-source
Dans l'esprit TradingView, le créateur de ce script l'a rendu open source afin que les traders puissent examiner et vérifier ses fonctionnalités. Bravo à l'auteur! Bien que vous puissiez l'utiliser gratuitement, n'oubliez pas que la republication du code est soumise à nos Règles.
Clause de non-responsabilité
Les informations et publications ne sont pas destinées à être, et ne constituent pas, des conseils ou recommandations financiers, d'investissement, de trading ou autres fournis ou approuvés par TradingView. Pour en savoir plus, consultez les Conditions d'utilisation.