OPEN-SOURCE SCRIPT
Range Gap/Open to Close/Close to Close

This indicator shows the percentage variation of:
gap
close to close (day including gap)
open to close (without gap)
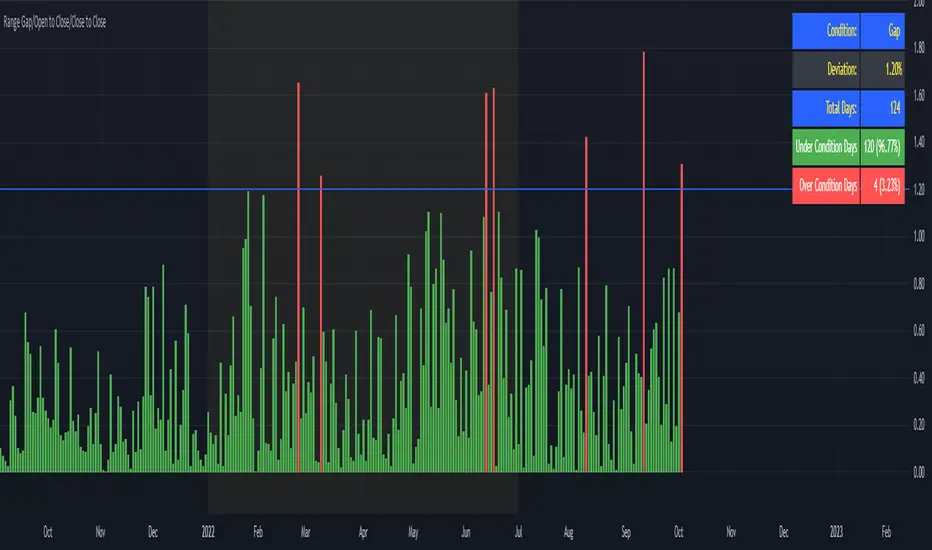
The green bars represent the days when the variation did not reach the selected range. The red bars show the days when the variation was higher than the selected range.
Best timeframe : DAY
gap
close to close (day including gap)
open to close (without gap)
The green bars represent the days when the variation did not reach the selected range. The red bars show the days when the variation was higher than the selected range.
Best timeframe : DAY
Notes de version
DescriptionThis indicator allows you to see in a quick and friendly way the number of occurrences that exist in an index, stock or ETF.
It is an indicator that is useful for those who are interested in the world of options and study strategies such as IRON CONDORS, IRON BUTTERFLIES, spreads, verticals and others.
For statistical purposes, it shows how many times an asset exceeded or not a certain percentage of a gap (daily), from a close to the next close (daily) or from the open to the close in the same day.
It is recommended to use it in daily temporality, although it can be used in any other one you want.
Parameters
Conditions: [Gap, Close To Close, Open To Close].
* Gap: or Close to Open, refers to the gap from the close of one day to the open of the next day.
* Close To Close, refers to the close of one day to the close of the next day.
* Open To Close, refers to the open of one day until the close of the same day.
Target Percentage: refers to the percentage of deviation to be tested. Note that it does not matter if the deviation was positive or negative.
Star Date: Start date of the sample.
End Date: End date of the sample.
Apply Filter From: Uncheck if you do not want to select a start date (the sample starts from the first day TV has in its history).
Apply Filter Until: Uncheck if you want the sample to end on the current day.
Output Table:
The table at the top right shows:
Condition: your current selected condition (Gap, Close to Close or Open To Close).
Deviation: your current selected deviation.
Total Days: number of days the sample has.
Under Condition Days: number of days that do not reach the selected deviation percentage.
Over Condition Days: number of days that exceeded the selected deviation percentage.
Script open-source
Dans l'esprit TradingView, le créateur de ce script l'a rendu open source afin que les traders puissent examiner et vérifier ses fonctionnalités. Bravo à l'auteur! Bien que vous puissiez l'utiliser gratuitement, n'oubliez pas que la republication du code est soumise à nos Règles.
Clause de non-responsabilité
Les informations et publications ne sont pas destinées à être, et ne constituent pas, des conseils ou recommandations financiers, d'investissement, de trading ou autres fournis ou approuvés par TradingView. Pour en savoir plus, consultez les Conditions d'utilisation.