PROTECTED SOURCE SCRIPT
Mis à jour CCI+MACD+VWAP+Breakout

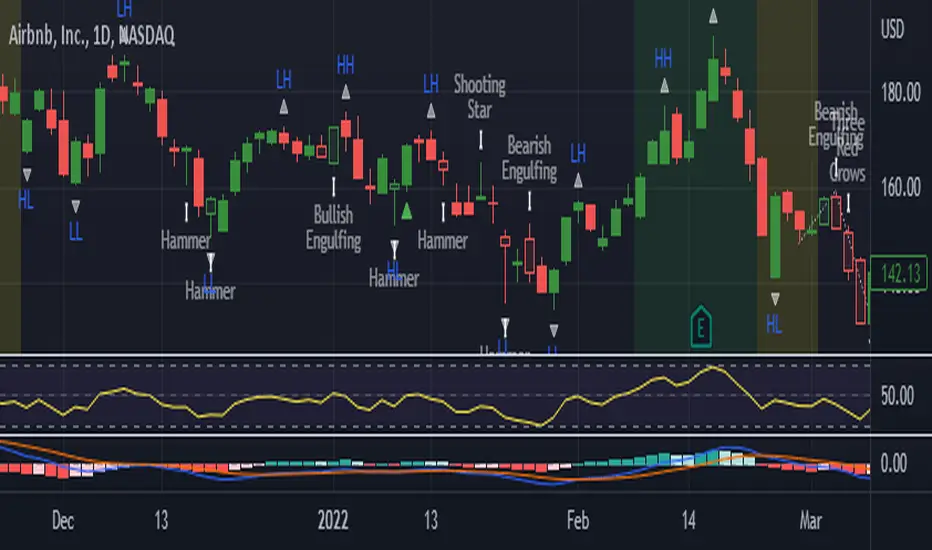
Design for LONG and Day Trade only
- Identify buy and sell signal using CCI
- Green Zone when
-- Price over VWAP
-- EMA9 > EMA50 > EMA200
-- MACD fast > MACD slow
- Yellow Zone when either one failed
- White line occurs when breakout of Higher High + Higher Low
- Identify buy and sell signal using CCI
- Green Zone when
-- Price over VWAP
-- EMA9 > EMA50 > EMA200
-- MACD fast > MACD slow
- Yellow Zone when either one failed
- White line occurs when breakout of Higher High + Higher Low
Notes de version
Design for LONG and Day Trade only- Identify buy and sell signal using CCI
- Green Zone when
-- Price over VWAP
-- EMA9 > EMA50 > EMA200
-- MACD fast > MACD slow
- Yellow Zone when either one failed
- White line occurs when breakout of Higher High + Higher Low
Notes de version
**** Design for Day Trade Only ****New Revision [2022-07-25]
- Show Breakout Signal (green triangle) after a higherhigh and a lowerhigh occur and volatility decreasing
- Show Candle Pattern Analysis with [on / off]
- Show the trendline with [on / off]
- Show HH, LH, LL, LH with [on / off]
- Yellow Zone (backgrand) when Moving average fast line crossover slow line
- Green Zone (backgrand) when Moving average fast line crossover slow line and MACD crossover and RSI <= 80
Script protégé
Ce script est publié en source fermée. Cependant, vous pouvez l'utiliser librement et sans aucune restriction – pour en savoir plus, cliquez ici.
Clause de non-responsabilité
Les informations et publications ne sont pas destinées à être, et ne constituent pas, des conseils ou recommandations financiers, d'investissement, de trading ou autres fournis ou approuvés par TradingView. Pour en savoir plus, consultez les Conditions d'utilisation.