OPEN-SOURCE SCRIPT
Pure Coca
Pure Coca - Trend & Mean Reversion Indicator
Overview
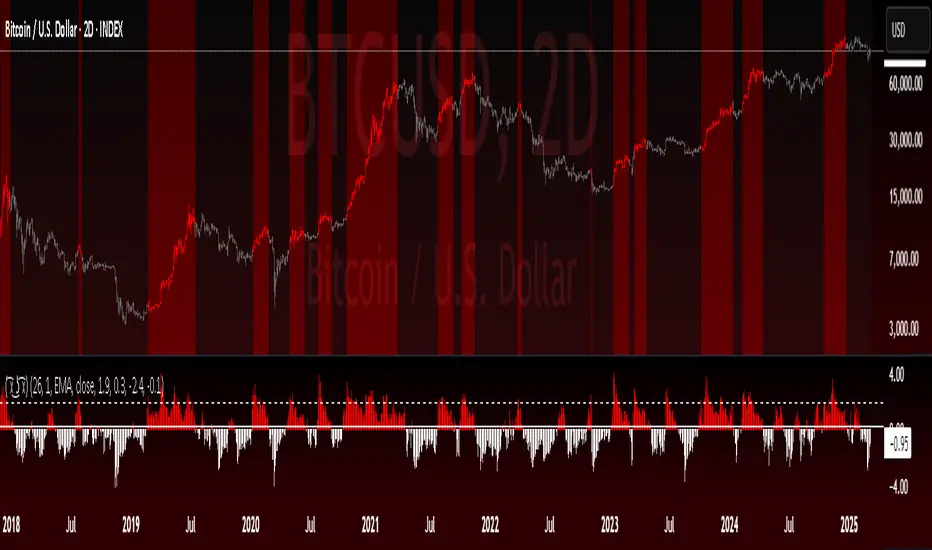
The Pure Coca indicator is a trend and mean reversion analysis tool designed for identifying dynamic shifts in market behavior. By leveraging Z-score calculations, this indicator captures both trend-following and mean-reverting periods, making it useful for a wide range of trading strategies.
What It Does
📉 Detects Overbought & Oversold Conditions using a Z-score framework.
🎯 Identifies Trend vs. Mean Reversion Phases by analyzing the deviation of price from its historical average.
📊 Customizable Moving Averages (EMA, SMA, VWMA, etc.) for smoothing Z-score calculations.
🔄 Adaptable to Any Timeframe – Default settings are optimized for 2D charts but can be adjusted to suit different market conditions.
How It Works
Computes a Z-score of price movements, normalized over a lookback period.
Plots upper and lower boundaries to visualize extreme price movements.
Dynamic Midlines adjust entry and exit conditions based on market shifts.
Background & Bar Coloring help traders quickly identify trading opportunities.
Key Features & Inputs
✔ Lookback Period: Adjustable period for calculating Z-score.
✔ Custom MA Smoothing: Choose from EMA, SMA, WMA, VWAP, and more.
✔ Z-Score Thresholds: Set upper and lower bounds to define overbought/oversold conditions.
✔ Trend vs. Mean Reversion Mode: Enables traders to spot momentum shifts in real-time.
✔ Bar Coloring & Background Highlights: Enhances visual clarity for decision-making.
How to Use It
Trend Trading: Enter when the Z-score crosses key levels (upper/lower boundary).
Mean Reversion: Look for reversals when price returns to the midline.
Custom Optimization: Adjust lookback periods and MA types based on market conditions.
Why It's Unique
✅ Combines Trend & Mean Reversion Analysis in one indicator.
✅ Flexible Z-score settings & MA choices for enhanced adaptability.
✅ Clear visual representation of market extremes.
Final Notes
This indicator is best suited for discretionary traders, quantitative analysts, and systematic traders looking for data-driven market insights. As with any trading tool, use in conjunction with other analysis methods for optimal results.
Overview
The Pure Coca indicator is a trend and mean reversion analysis tool designed for identifying dynamic shifts in market behavior. By leveraging Z-score calculations, this indicator captures both trend-following and mean-reverting periods, making it useful for a wide range of trading strategies.
What It Does
📉 Detects Overbought & Oversold Conditions using a Z-score framework.
🎯 Identifies Trend vs. Mean Reversion Phases by analyzing the deviation of price from its historical average.
📊 Customizable Moving Averages (EMA, SMA, VWMA, etc.) for smoothing Z-score calculations.
🔄 Adaptable to Any Timeframe – Default settings are optimized for 2D charts but can be adjusted to suit different market conditions.
How It Works
Computes a Z-score of price movements, normalized over a lookback period.
Plots upper and lower boundaries to visualize extreme price movements.
Dynamic Midlines adjust entry and exit conditions based on market shifts.
Background & Bar Coloring help traders quickly identify trading opportunities.
Key Features & Inputs
✔ Lookback Period: Adjustable period for calculating Z-score.
✔ Custom MA Smoothing: Choose from EMA, SMA, WMA, VWAP, and more.
✔ Z-Score Thresholds: Set upper and lower bounds to define overbought/oversold conditions.
✔ Trend vs. Mean Reversion Mode: Enables traders to spot momentum shifts in real-time.
✔ Bar Coloring & Background Highlights: Enhances visual clarity for decision-making.
How to Use It
Trend Trading: Enter when the Z-score crosses key levels (upper/lower boundary).
Mean Reversion: Look for reversals when price returns to the midline.
Custom Optimization: Adjust lookback periods and MA types based on market conditions.
Why It's Unique
✅ Combines Trend & Mean Reversion Analysis in one indicator.
✅ Flexible Z-score settings & MA choices for enhanced adaptability.
✅ Clear visual representation of market extremes.
Final Notes
This indicator is best suited for discretionary traders, quantitative analysts, and systematic traders looking for data-driven market insights. As with any trading tool, use in conjunction with other analysis methods for optimal results.
Script open-source
Dans l'esprit TradingView, le créateur de ce script l'a rendu open source afin que les traders puissent examiner et vérifier ses fonctionnalités. Bravo à l'auteur! Bien que vous puissiez l'utiliser gratuitement, n'oubliez pas que la republication du code est soumise à nos Règles.
Clause de non-responsabilité
Les informations et publications ne sont pas destinées à être, et ne constituent pas, des conseils ou recommandations financiers, d'investissement, de trading ou autres fournis ou approuvés par TradingView. Pour en savoir plus, consultez les Conditions d'utilisation.