OPEN-SOURCE SCRIPT
Price Changes Relative to Previous Close

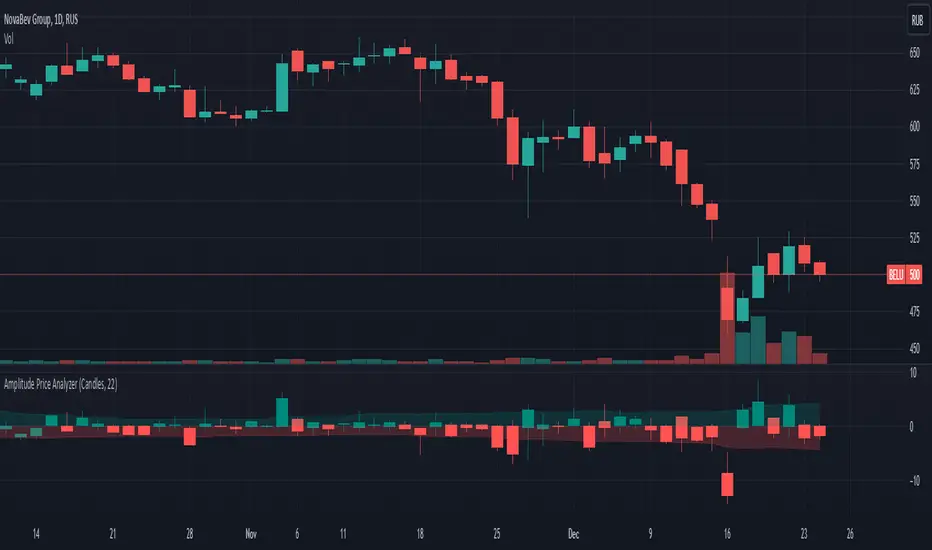
This script displays the price values in percentages (open, high, low, and close) of the current bars relative to the previous bar's close. This helps visualize the amplitude of price movements. Depending on the user's choice, the display can be in the form of candles or bars.
Main steps of the script
Изменение цен относительно предыдущего закрытия
Этот скрипт отображает значения цен в процентах (открытие, высокие, низкие и закрытие) текущих баров относительно закрытия предыдущего бара. Это помогает визуализировать амплитуду движений цен. В зависимости от выбора пользователя, отображение может быть в виде свечей или баров.
Основные шаги скрипта
Main steps of the script
- Retrieves the previous bar's closing price.
- Calculates the percentage changes in the open, high, low, and close prices of the current bar relative to the previous bar's close.
- Sets the colors for bullish (green) and bearish (red) candles/bars.
- Allows the user to choose the display type (candles or bars).
- Displays the candles or bars on the chart.
- Creates arrays to store the highs and lows of the last 252 bars and filters them based on the current bar's close.
- Calculates the average values of the highs and lows for the filtered bars and displays them on the chart.
Изменение цен относительно предыдущего закрытия
Этот скрипт отображает значения цен в процентах (открытие, высокие, низкие и закрытие) текущих баров относительно закрытия предыдущего бара. Это помогает визуализировать амплитуду движений цен. В зависимости от выбора пользователя, отображение может быть в виде свечей или баров.
Основные шаги скрипта
- Получает цену закрытия предыдущего бара.
- Вычисляет процентные изменения открытой, высокой, низкой и закрытой цен текущего бара относительно закрытия предыдущего бара.
- Настраивает цвета для бычьих (зелёных) и медвежьих (красных) свечей/баров.
- Позволяет пользователю выбирать тип отображения (свечи или бары).
- Отображает свечи или бары на графике.
- Создаёт массивы для хранения максимумов и минимумов за последние 252 бара и фильтрует их в зависимости от закрытия текущего бара.
- Вычисляет средние значения максимумов и минимумов для отфильтрованных баров и отображает их на графике.
Script open-source
Dans l'esprit TradingView, le créateur de ce script l'a rendu open source afin que les traders puissent examiner et vérifier ses fonctionnalités. Bravo à l'auteur! Bien que vous puissiez l'utiliser gratuitement, n'oubliez pas que la republication du code est soumise à nos Règles.
Clause de non-responsabilité
Les informations et publications ne sont pas destinées à être, et ne constituent pas, des conseils ou recommandations financiers, d'investissement, de trading ou autres fournis ou approuvés par TradingView. Pour en savoir plus, consultez les Conditions d'utilisation.