OPEN-SOURCE SCRIPT
Shadow Edge (Example)
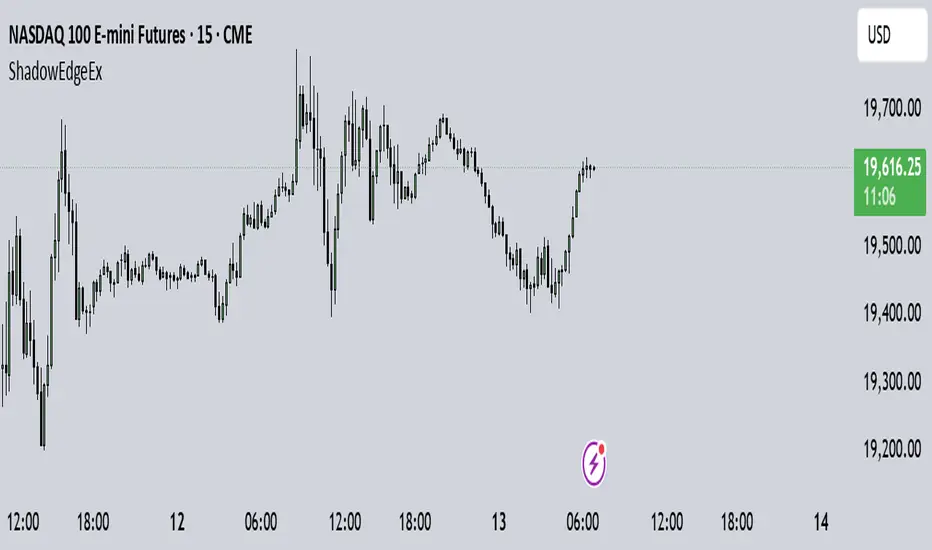
This script tracks hourly price extremes (highs/lows) and their equilibrium (midpoint), plotting them as dynamic reference lines on your chart. It helps visualize intraday support/resistance levels and potential price boundaries.
Key Features
Previous Hour Levels (Static Lines):
PH (Previous Hour High): Red line.
PL (Previous Hour Low): Green line.
P.EQ (Previous Hour Equilibrium): Blue midpoint between PH and PL.
Current Hour Levels (Dynamic/Dotted Lines):
MuEH (Current Hour High): Yellow dashed line (updates in real-time).
MuEL (Current Hour Low): Orange dashed line (updates in real-time).
Labels: Clear text labels on the right edge of the chart for easy readability.
How It Works
Hourly Tracking:
Detects new hours using the hour(time) function.
Resets high/low values at the start of each hour.
Stores the previous hour’s PH, PL, and P.EQ when a new hour begins.
Dynamic Updates:
Continuously updates MuEH and MuEL during the current hour to reflect the latest extremes.
Customization
Toggle visibility of lines via inputs:
Enable/disable PH, PL, P.EQ, MuEH, MuEL individually.
Adjustable colors and line styles (solid for previous hour, dashed for current hour).
Use Case
Intraday Traders: Identify hourly ranges, breakout/retracement opportunities, or mean-reversion setups.
Visual Reference: Quickly see where price is relative to recent hourly activity.
Technical Notes
Overlay: Plots directly on the price chart.
Efficiency: Uses var variables to preserve values between bars.
Labels: Only appear on the latest bar to avoid clutter.
This tool simplifies intraday price action analysis by combining historical and real-time hourly data into a single visual framework.
Script open-source
Dans l'esprit TradingView, le créateur de ce script l'a rendu open source afin que les traders puissent examiner et vérifier ses fonctionnalités. Bravo à l'auteur! Bien que vous puissiez l'utiliser gratuitement, n'oubliez pas que la republication du code est soumise à nos Règles.
Clause de non-responsabilité
Les informations et publications ne sont pas destinées à être, et ne constituent pas, des conseils ou recommandations financiers, d'investissement, de trading ou autres fournis ou approuvés par TradingView. Pour en savoir plus, consultez les Conditions d'utilisation.